
About the Author:
Lukas Vileikis is an ethical hacker and a frequent conference speaker.
Since 2014, Lukas has found and responsibly disclosed security flaws in some of the most visited websites in Lithuania.
He runs one of the biggest & fastest data breach search engines in the world -
BreachDirectory.com, frequently speaks at conferences and blogs in multiple places including
his blog over at lukasvileikis.com.
----------------------------------------------------------------------------------------------------------

If you’re a database administrator, chances are that sometimes you might catch yourself thinking about your database processes – is there something that needs improving? How can you make sure that your database processes are as effective as possible? Are there bottlenecks? How can those be tackled and subsequently removed? How to remove them without causing trouble (e.g downtime etc.) for your database instance(s) or for your web application?
When considering your options, you might also have caught yourself thinking about database automation: is there a chance that you could possibly automate at least some of the database processes in your application? And if there is, is there a tool that can help you do all that easily and conveniently? Yes, there is – if you’re dealing with issues with your database processes, dbWatch could certainly become one of your options.
Why Should You Wish to Automate Database Processes?
Automating database processes has a lot of upsides for you, your organization, and, of course, your database instance(s):
- 1. Processes and tools can be leveraged to make administrative tasks for a database simpler and safer meaning that the maintenance of your database processes takes less and less of your own time.
- 2. Database automation helps you avoid database-based errors (timeouts, deadlocks etc.) by detecting them and also letting you fix them afterwards.
- 3. Database automation can detect various issues with your database, then alert you should something go wrong.
- 4. Database automation might help your organization reduce expenses because as database processes are automated, DBAs or other staff might move into different roles or made redundant altogether.
Automating Database Processes with dbWatch
As far as database process automatization is concerned, you indeed have a few choices. Those choices can help you tackle various issues including the issues outlined above. Now we will look at one of them – we will look at dbWatch.
Here’s how dbWatch looks from the inside:
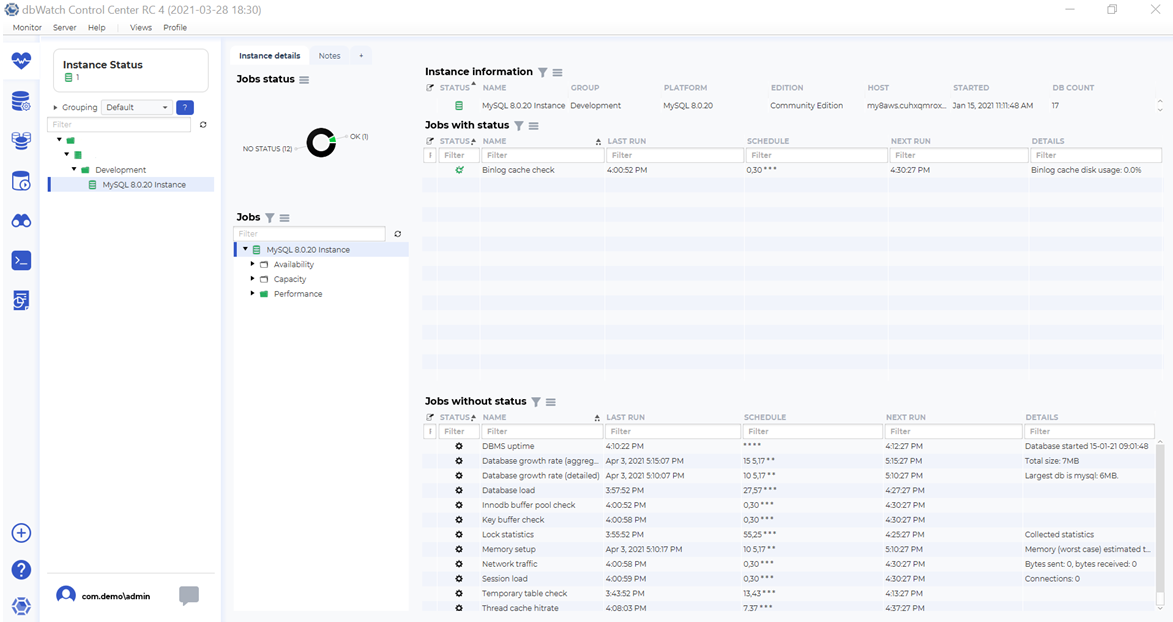
As you can see, dbWatch has quite a lot of features. The majority of useful things derived from those features come down to the dbWatch jobs which have three categories – these jobs can be categorized into Availability, Capacity and Performance. To see what those categories contain, simply expand one or more of them. For example:
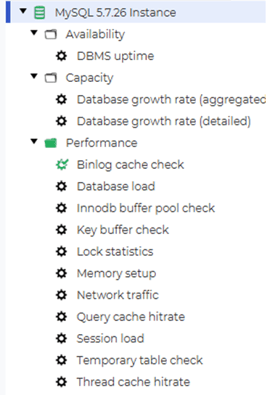
In the above example, we can clearly see that the Availability category has one job that informs you about your database uptime, the Capacity category has two jobs each one dedicated to letting you observe your database growth rate – be it in a detailed or an aggregated form and the Performance category has the biggest amount of jobs that you can put to work in order to achieve database automation for your database instance(s):
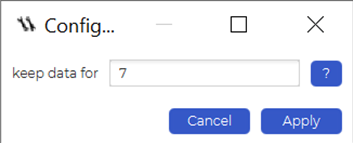
- The database load job can inform provide you with some information regarding your database load taking the maintenance of your database processes off your hands – it can inform you whether your database load is low, average or high etc. This job can also be configured to hold data for a specified amount of days:
- - The InnoDB buffer pool checking job can automatically alert you should something go awry with your InnoDB installation – for example, if the hit ratio falls below a specified percentage etc.
- - The MyISAM key buffer checking job can automatically give you an alarm or a warning if your MyISAM key buffer utilization exceeds a specified percentage or if the read ratio exceeds a certain specified percentage. You can also specify the amount of days you want to hold the data for.
- - The lock statistics job collects information about the lock statistics and the memory setup job analyzes the memory setup of the server allowing you to automate your database processes without needing to constantly check how much of the servers’ memory is allocated where therefore automating your database processes and saving you time aswell – simply run the jobs before attempting any major procedure on your database instance(s) and you should be good to go.
- - The network traffic and session load jobs show the network traffic and connection statistics. Those can be useful to run in the middle of other jobs (for example, after you check the effectiveness of your InnoDB buffer pool and (or) your MyISAM key buffer pool)
- - If you want to know how much temporary tables are written to disk, you can also do that. The temporary table check job shows the percentage of temporary tables written to disk.
- - Finally, if you have optimized and automated some of your database processes with dbWatch, you can also make use of the thread cache hitrate job that should show you your thread cache hitting rate.
Aside from that, dbWatch also shows you the status of your database jobs – simply look into the top left side of dbWatch – jobs that have no status will be represented as having no status, other kinds of jobs (e.g jobs that have the status “OK”, “Warning” or “Alarm” will be represented accordingly). dbWatch also has something that’s known as a Farm Data Language (FDL) – FDL was formerly known as dbwql and it is the query language used by dbWatch to find information about certain objects. For example a query like so:
Instance/name
Would return all of the names of your database instances in dbWatch.
To fetch all of the tasks on a certain instance that has a name “Demo instance” you could use a FDL query like so:
Instance[name=”instance one”]/task
FDL could be a really powerful tool when automating the processes in your database instance(s) – for more examples about what FDL is and how you can use it to automate your database processes, head over to the ControlCenter’s documentation.
Summary
dbWatch makes the automation of your database processes quick and easy. The majority of dbWatch’s features are centered towards database-specific jobs or the Farm Data Language (FDL). Both the jobs and FDL can help you avoid database-based errors, detect various issues, save you time and also reduce the costs required to maintain database instances for your organization – put the dbWatch’s jobs and FDL to good use and you should be well on your path to successfully automating your database processes.
Other Blogs:
Managing your Database Instances with dbWatch
The hidden Gems of dbWatch - Understanding dbWatch internals


