Not only that, but you are also responsible for the database infrastructure planning, high availability planning, cluster configurations, database server configurations, patch management, backup, and maintenance management.
Sometimes, you are also involved with developing queries to support the application team; you have plenty of tasks to do with a limited time.
In the IT world – Firefighting means developers, DBA’s, or other IT personnel are required to resolve changes immediately. When you get alerted in the middle of the night of a critical production issue that needs to be fixed as soon as possible, you need to act on it immediately. You will need to analyze the alert and the instance, pinpoint the issue causing the situation, and fix it, be it bad SQL code, missing or fragmented indexes, or some other issue.
Reactive DBA VS. Proactive DBA
A reactive DBA is someone who focuses on resolving database problems, whether it is database performance issues, management issues, or configuration issues that he faces. On the other hand, a Proactive DBA is someone who implements best practices and take necessary precautions to eliminate or lessen problems that might occur in the future.
To avoid your decision-making being based on guessing, it is crucial to implement a proactive monitoring solution to gather data and help you with your decision making for implementing improvements and changes on the databases you are managing. You need a proactive database monitoring solution that will assist you in automating database monitoring, data collection, and analysis.
The technology must make it easier for you and other DBAs to understand your database performance; it must be easy to use and helps you detect unusual behavior, identify the root cause of database performance bottlenecks, and restore performance the way it should function.
dbWatch Control Center (CC) allows you to track your database health and performance using different database monitoring jobs for every performance metric.
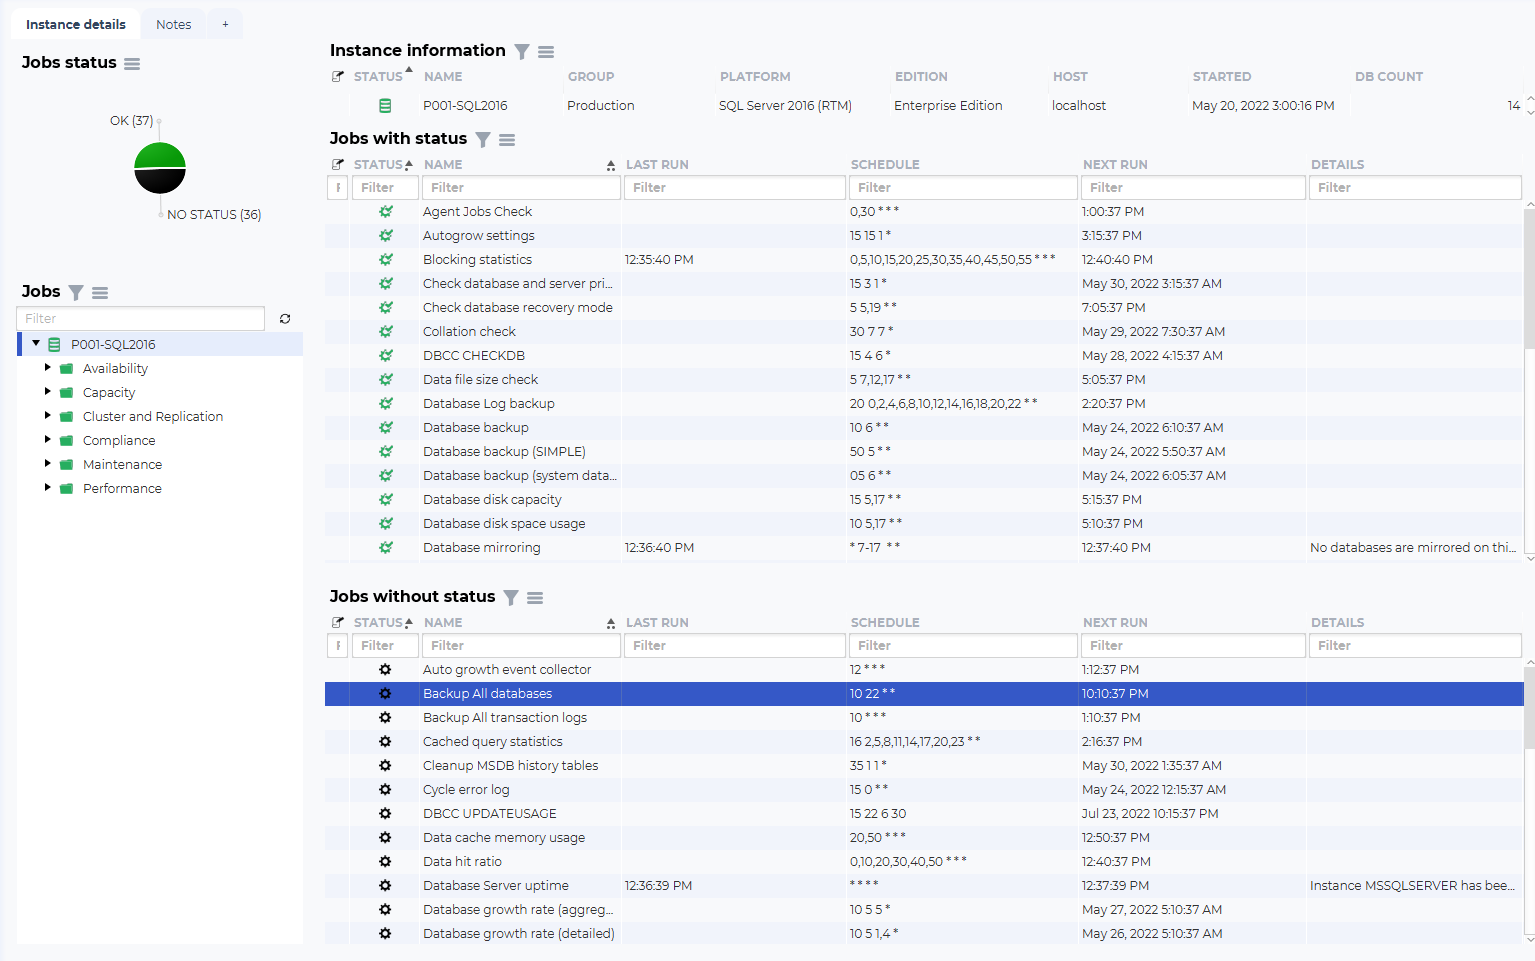
dbWatch Control Center gives you the ability to monitor any unusual behavior in your database performance like your CPU usage rate, memory usage rate, blocking sessions, deadlock monitoring, etc.
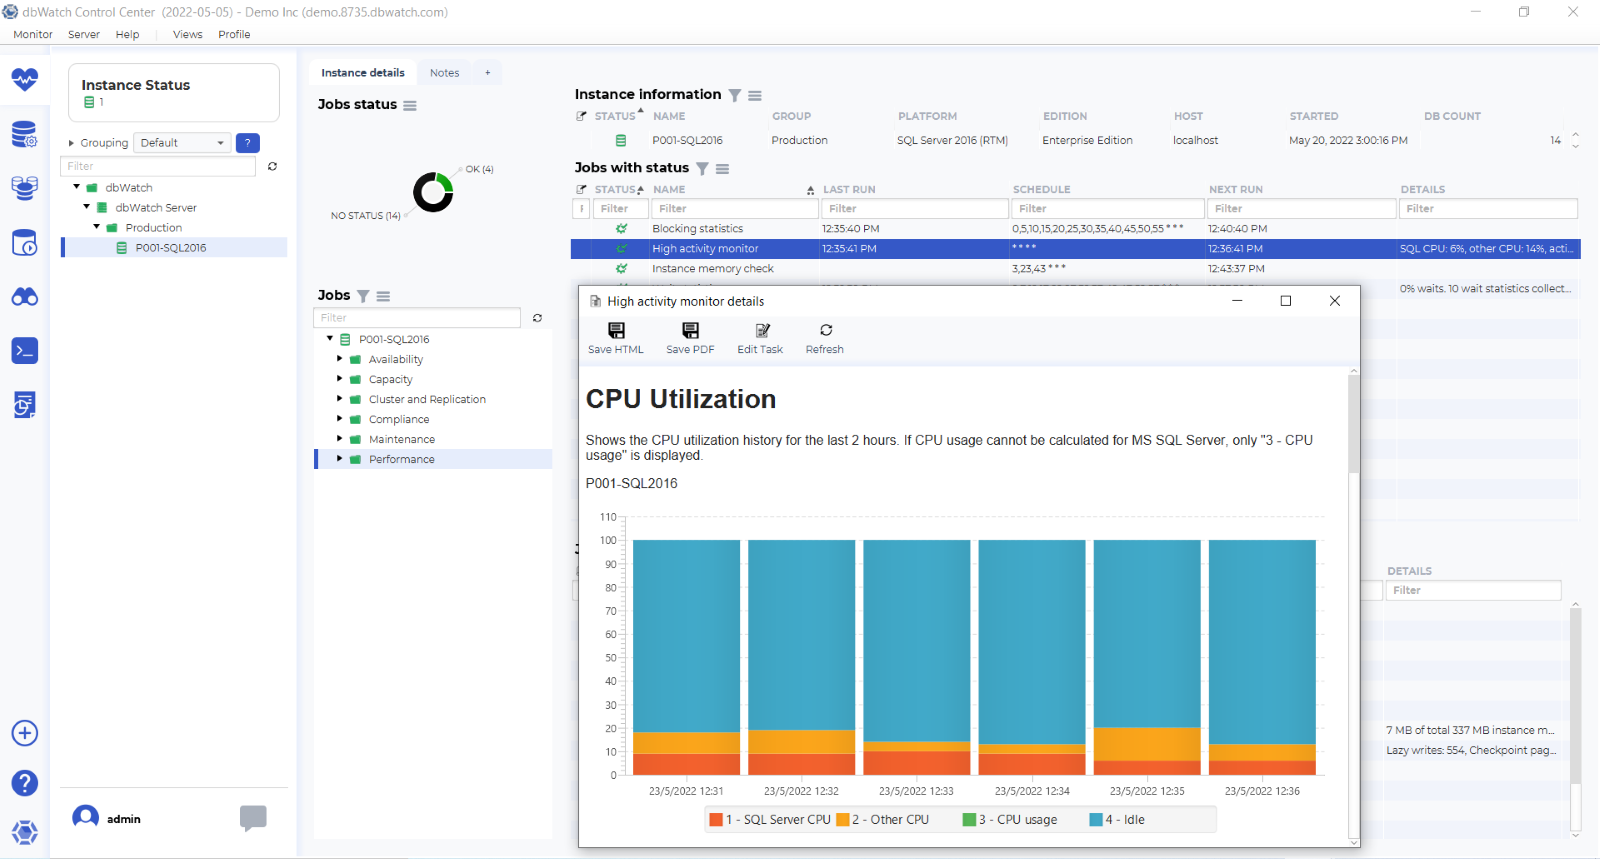
With dbWatch Control Center, you can now analyze CPU usage trends and determine when the instance is at its peak regarding resource usage.
Summary
With dbWatch Control Center being your partner in proactive database monitoring and managing your databases, you could achieve the following:
- - Proactive monitoring with an overview of all databases. It provides you with the necessary information for you to act against possible issues.
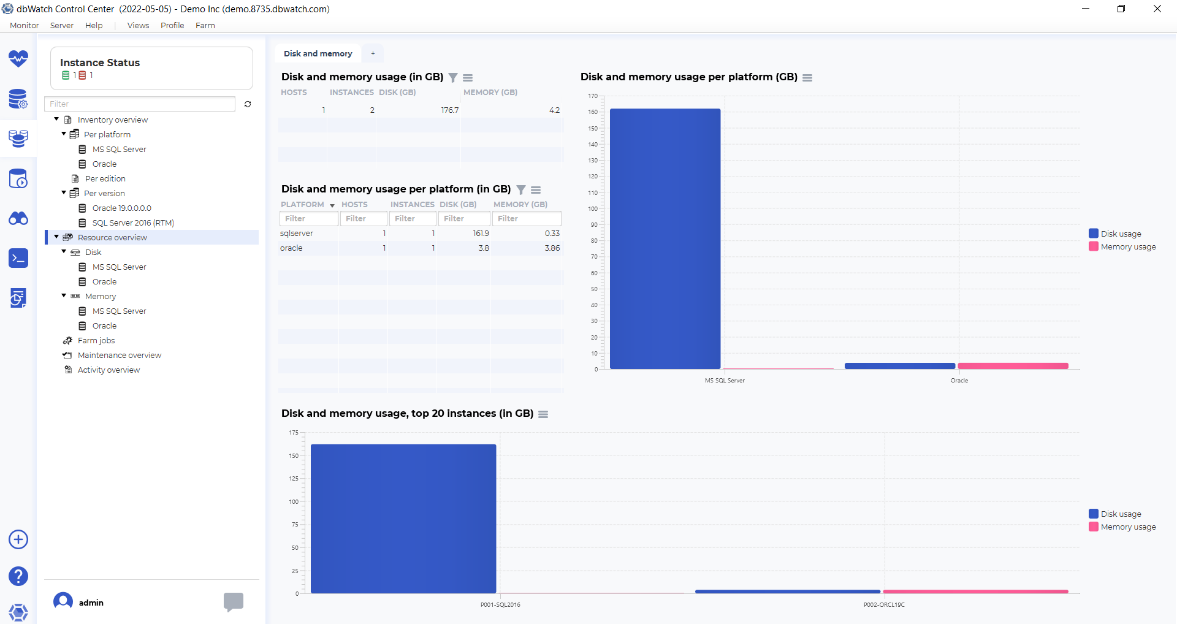
- - Provides complete information on your databases total allocated hardware, and resource utilization like your CPU, memory, and disk usage.
- - Delivers information for performance metrics and identifies which database platforms and versions are running in the enterprise.
Try dbWatch Control Center today! https://info.dbwatch.com/download-dbwatch-controlcenter
For more information, visit www.dbWatch.com or https://wiki.dbwatch.com/ControlCenter/
-------------
Other blogs:
Multiplatform database farm monitoring, management solution, and inventory management with dbWatch Control Center for Oracle, MySQL, SQL Server, and PostgreSQL
Be proactive and productive with dbWatch Control Center
Chad Pabalan is a Pre-Sales Engineer for dbWatch and a DBA specializing in SQLServer high availability setups and disaster recovery planning and configurations. He is an AWS Certified Solutions Architect Professional, a cloud enthusiast specializing in architecture and designing scalable, high available, and fault-tolerant systems on AWS Cloud.


