Each database platform and sometimes each version come with their own set of tools, it is a waste of time switching through multiple applications just to monitor and manage hundreds of database instances.
dbWatch is the perfect solution to monitor and track all your instances for you. The dbWatch alert module is powerful and flexible, so you can configure precisely how you receive alerts, what alerts you receive, who receives them and at what time of the day or week. In this way you can create alert rules to match work schedules with different alert schemes for office hours, nighttime and weekends.
See the example below.
I want to stay on top of our database farm and receive performance alerts like blocking transactions, deadlocks, failed database backups, high cpu and memory usage thru email or SMS. So that I could easily respond when an issue on our database farm arises especially during off work hours.
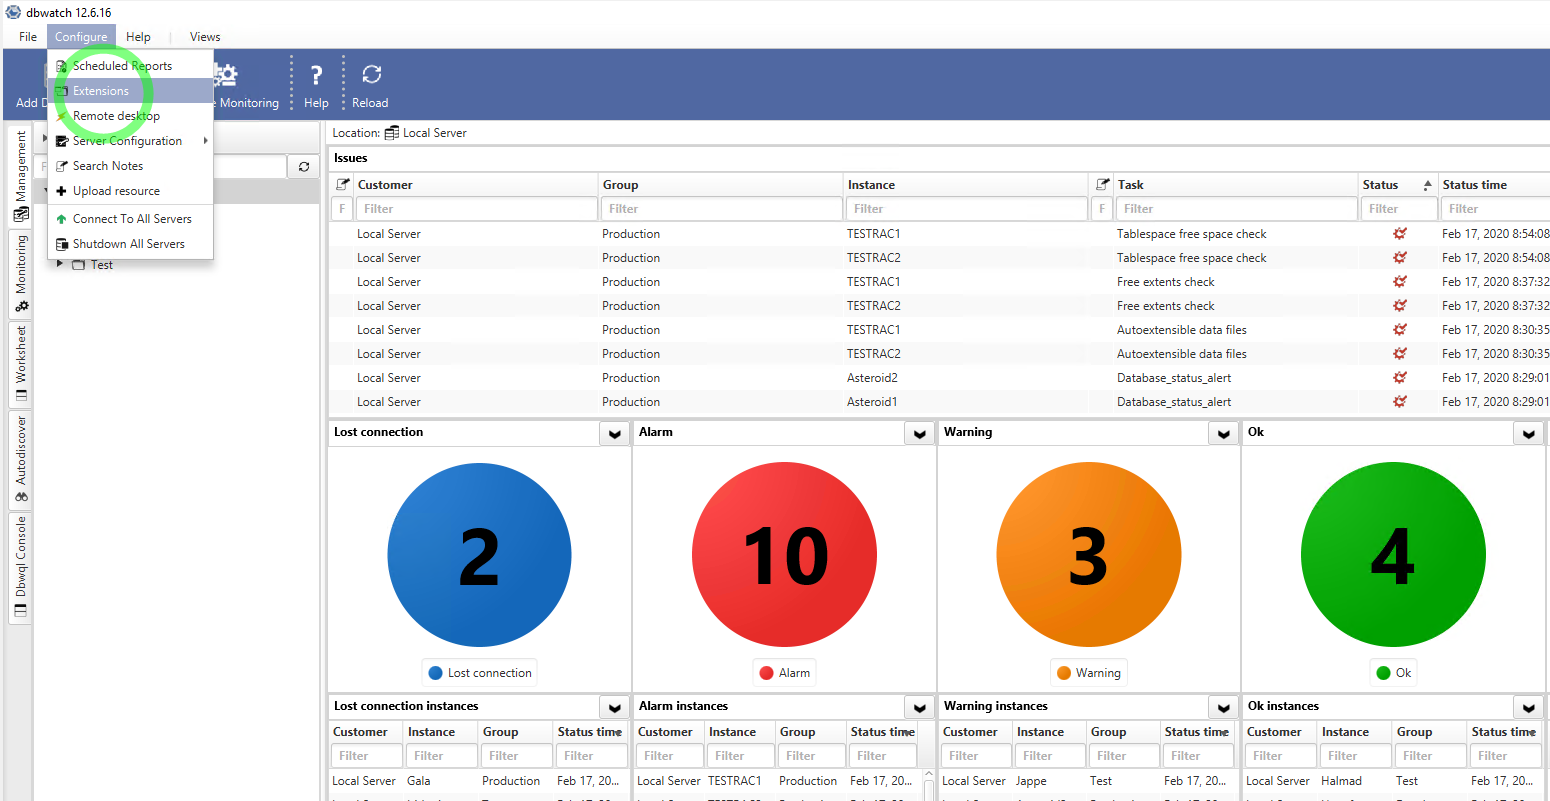
- On top choose Configure > Extensions
- In this window you will enable E-Mail extension for this demonstration
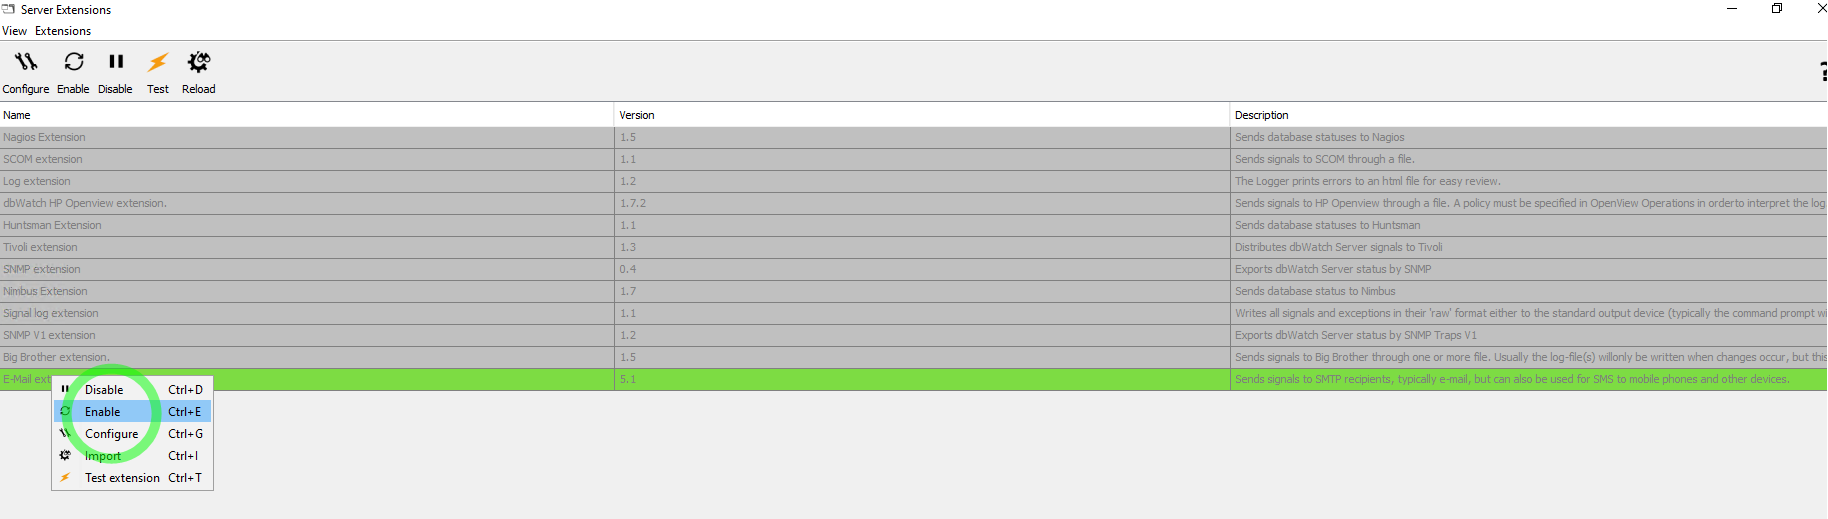
Within this window you will see various server extensions which you can use to send signals across different enterprise monitoring solutions, such as email, Nagios, SMS, OpenView etc.
Right click on E-mail extension and click enable.
- After enabling the email extension, On top choose Configure
A window will appear specify the following:
- SMTP Host - input your mail server/smtp settings
- SMTP Port - input your smtp port number
- Username/Password - input the email credential which you will use to send the alert
- From address - this field is the same with username as this email will be the one sending the alerts
- Subject - input the subject for the alert
After filling up the properties > Click Add Rule.
Below will appear a box, specify the following information:
Rule name - input the name of this rule
- Type - select whether you want to send it thru email or SMS
- Receivers - specify the receivers of this notification
- Schedules - click Edit to set a schedule for the frequency check
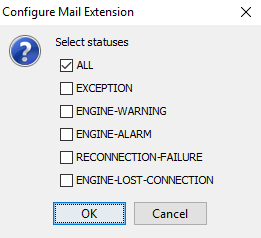
Statuses - click Edit to choose from the following status
-
- Type - select whether you want to send it thru email or SMS
- Receivers - specify the receivers of this notification
- Schedules - click Edit to set a schedule for the frequency check
- Statuses - click Edit to choose from the following status
- Group filter - click Edit, you can either include or exclude the selected server groups
- DBMS type filter - click Edit, you can either include or exclude the selected dbms types (ex. oracle, sqlserver, mysql)
- Instance filter - click Edit, you can either include or exclude the selected instances
- Package filter - click Edit, you can either include or exclude the selected packages (ex. AlwaysOn, Capacity, Cluster, Replication, Maintenance, Performance)
- Check filter - click Edit, you can either include or exclude the selected performance checks (ex. DBCC CheckDB, High Activity, Blocking alerts, etc..)
- After filling up the all the necessary information for this rule, click Save.
Here is a sample email alert of a failed check execution in Oracle which I've received from the dbWatch monitor.
We have successfully configured an alert notification, you can easily customize and create your own rules based on your requirements.
For more information, visit:
http://wiki.dbwatch.com/12.7/en/topic/email-and-sms1
Follow us on Facebook, Twitter, Youtube, LinkedIn


