
If you are a developer that deals with MySQL or a MySQL database administrator, you probably know what MySQL database engines are. One of the most popular database engines as far as MySQL or MariaDB is concerned is InnoDB. – This storage engine is very widely regarded as a high-performance storage engine that also balances high performance with high reliability.
----------------------------------------------------------------------------------------------------------

How does InnoDB Ensure High Performance and Reliability?
If you ask a MySQL database administrator or a developer who deals with databases, how does InnoDB ensure high performance and reliability? You will probably hear the term “ACID” being mentioned. As it deals with databases, the term ACID is an acronym for four words: Atomicity, Consistency, Isolation, and Durability. Here’s how InnoDB ensures that the ACID parameters are being followed:
- - InnoDB can ensure that statements in a transaction operate as an indivisible unit, and their effects are either seen collectively or not seen at all.
- - InnoDB has logging mechanisms that record all of the changes to the database.
- - InnoDB has row-level locking.
- - InnoDB also tracks all of the changes to the system by maintaining a log file.
It is worth noting that not all InnoDB engines are ACID-compliant “out of the box”. – ACID-compliance for InnoDB is controlled by the innodb_flush_log_at_trx_commit variable in my.cnf. This variable has three possible options: zero (0), one (1), and two (2). The default value is 1 – this value makes InnoDB ACID compliant. The other two values, 0 and 2, can be used to achieve faster write speeds, but then InnoDB will no longer be ACID-compliant, and so the engine can lose up to one second’s worth of transactions.
In general, the innodb_flush_log_at_trx_commit parameter controls how to perform fsync operations. – fsync() is a Linux function that transfers (“flushes”) all modified data in such a way that forces a physical write of data from the buffer cache. – iIt also ensures that all of the data up to the time that the when fsync() call was invoked is will be recorded on the disk after a system crash, power outage or any other hiccup.
How can dbWatch Help Ensure InnoDB High Performance and Reliability?
If you want to ensure that your MySQL InnoDB instances follow high performance and reliability principles, keep an eye on dbWatch. dbWatch has quite a few jobs that are aimed to ensure that the performance of your InnoDB instances will follows the high performance and high-reliability principles. Here’s how that looks like at the time this blog post is written:
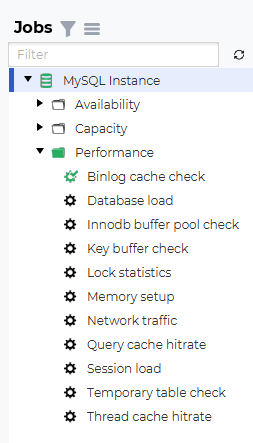
Image 1 - dbWatch Performance jobs
Simply expand the Performance job section and you will see a couple of database-based jobs that can help you monitor the binlog cache, monitor your database load, and your lock statistics. It can show you your memory setup, your query cache hit rate, session load, temporary table status, etc. But we are interested in one job – that’s the InnoDB buffer pool checking job.
Right-click the job, click Details, and you should see this screen which explains what the job does in detail:
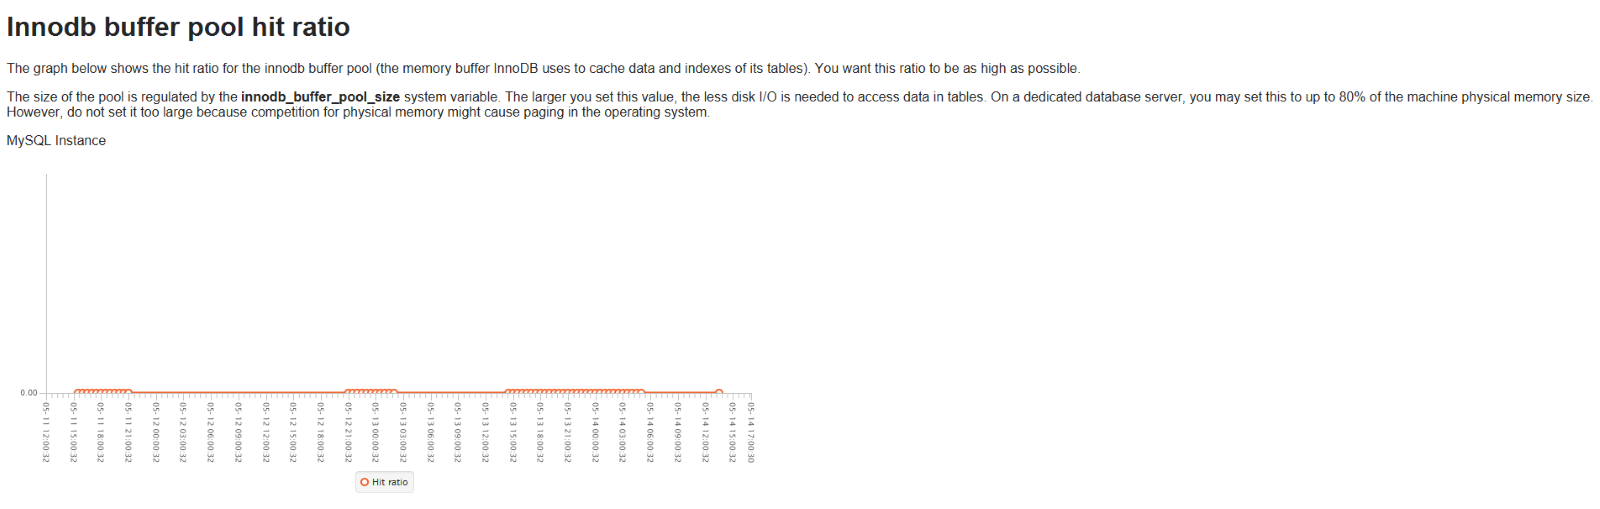
Image 2 - InnoDB buffer pool hit ratio details
This graph depicts the hit ratio for the InnoDB buffer pool. In order to ensure that your InnoDB instances follow high-performance principles, aim for:
- The hit ratio to be as high as possible – when InnoDB cannot read from the buffer pool, the disk is accessed. Queries hitting the disk are usually slower.
- A large InnoDB buffer pool value – the larger it is, the less disk I/O is needed to access data in tables.
To set these parameters up, you might want to make use of the free –h command (this command displays how much RAM is free in your system in a human-readable format) – to make a good decision, evaluate your project needs upfront and account the RAM usage for the applications that will run on your server.
To account for the InnoDB buffer pool value properly, keep in mind that this value can be set to up to 80% of free memory on Linux (on Windows machines, it’s a little bit less). The more memory you allow for InnoDB to use in this scenario, the more performant it will be.
dbWatch also shows you a graph that depicts the actual usage of the InnoDB buffer pool by your database instances. – it shows the total number of the buffer pool read requests and how many of them accessed the disk:
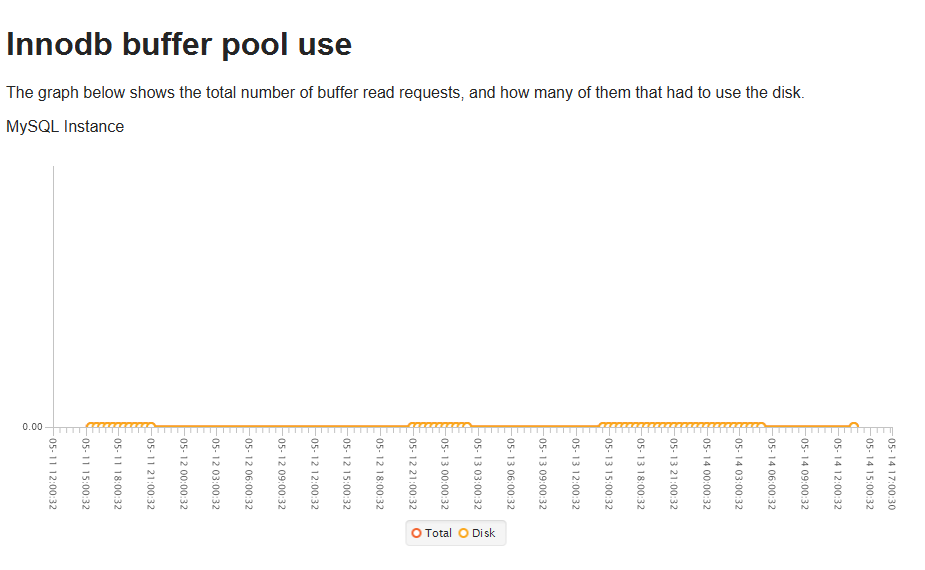
Image 3 - the usage of the InnoDB buffer pool
dbWatch also allows you to configure this job easily –right-click and click Configure, and you should see this screen:
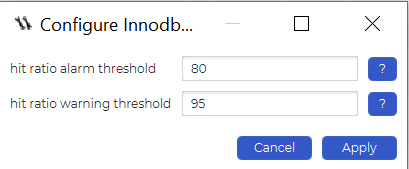
As you can see, dbWatch also lets you configure the hit ratio alarm and warning thresholds., mMeaning that you will be presented with a warning or a notice if the InnoDB buffer pool hit ratio falls below specific values in percent (%).
Summary
InnoDB is widely known as a high-performance and high-reliability storage engine for most developers that deal with MySQL and MySQL DBAs. To push your InnoDB instances to the next level and help ensure they stay highly performant and reliable, use the jobs provided by dbWatch - doing so should help your database instances run smoothly and keep you sleeping soundly at night. If you need any further assistance, feel free to contact the team - they will be glad to help you out.
Other Blogs:
Dealing with DataOps in the Modern Age - the dbWatch Approach
Managing your Database Instances with dbWatch


