About the Author:
Rey Lawrence Torrecampo is a Pre-sales Engineer for dbWatch and full-time Database Administrator. He has extensive knowledge in Postgres and MSSQL database management systems with SQL as his most proficient language. Coupled with his experiences in Data Science and data migration, he has confidently handled roles in data migration job developments, data analytics and data cleansing.
----------------------------------------------------------------------------------------------------------

Many traditional solutions will not work when monitoring hundreds and thousands of instances. To make the lives of DBAs easier, we can utilize Farm Data Language (FDL) to create custom views for monitoring our databases.
The ABC of FDL
To understand FDL, we will use a familiar concept, precisely Structured Query Language or SQL. As a part of its function, SQL is requesting information from the database system, and in response, the database retrieves data under the user’s request.
SELECT column1, column_2 FROM table_A
You can read the simple SELECT statement above as we are fetching data in table_A, where rows retrieved will be for the entire table. That statement will return only two columns will be returned – column1 and column_2. Suppose that when you were writing the query, you mislabeled column_2 and its actual field name is column2; the query will return an error since no field name exists within the given table.
At a macro-level, a table should belong to a schema, and that schema should also be associate with a database. To access data, you need to specify which database, schema, and table it belongs to. In the simplest form, we have the following relationship:
Database > Schema > Tables > Columns and Rows > Data
Farm Data Language (FDL) works the same way. However, instead of accessing database entities such as tables and columns, FDL properties associate one property to another. To put it into perspective, let us look at a simple FDL Query:
instance->i/name{}/$i/task/version{}
With little to no prior knowledge of how it works, the FDL query can be intimidating to look at. We can break the query above to have a better understanding of how it works. We will first deep dive into three major operators:
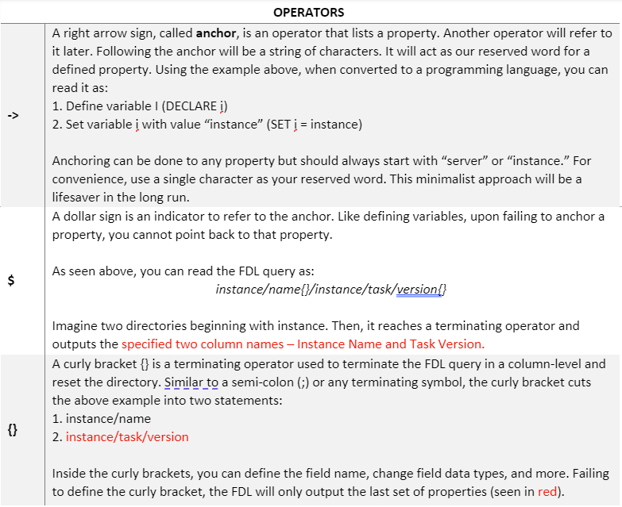
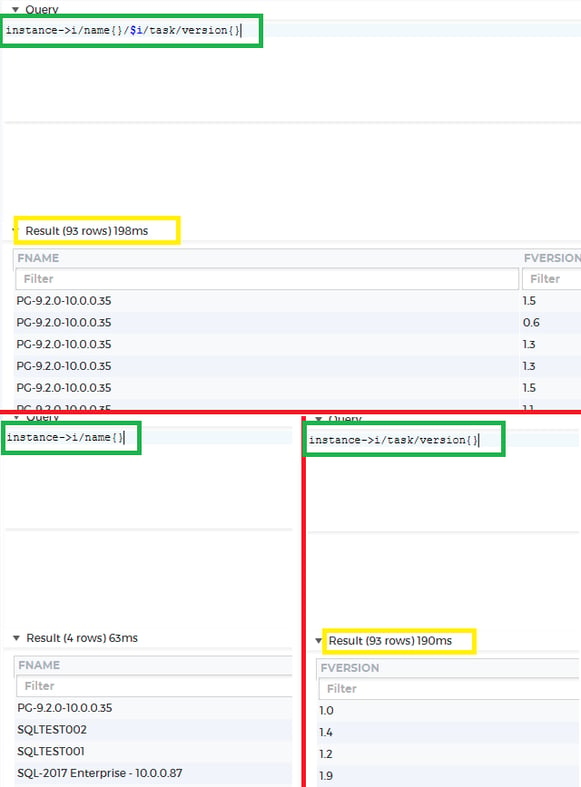
Figure 1
Now that we understand what FDL operators are, we’ll proceeding with its application. Figure 1 demonstrates how we can break down the FDL query. You have two statements: instance/name and instance/task/version. In the first statement, you need to get the instance name, while the second statement finds the most current version of all active dbWatch Control Center jobs.
Looking back at Figure 1, you see 93 rows on the upper image and the lower right image. With this information, we can infer that the cross product of the lower left image and lower right images results to upper section. Using the expression below, we can summarize the relationships of both statements.
instance/name{} X instance/task/version{} = instance->i/name{}/$i/task/version{}
The same expression also applies to any number of columns, as seen in Figure 2.

Figure 2
Now that you have a basic understanding of the FDL query, it should not be a challenge to read and understand Figure 2. We only did the following:
1. Filter Instance name to only SQLTEST002
2. Labeled all column names as displayed on screen – Instance Name, Job Name, Version Number, and Schedule
3. Change the data type for version/version number to float
FDL Application
The Monitoring Module is a key asset in maintaining your database farms. As a user, you can set customize alerts and define parameters to fine-tune your database in reaching its peak performance. Setting thresholds values is only one way of customization; with the knowledge of FDL, you can unlock the full capacity of the Monitoring Module.
The monitoring module comes with a number of standard views written in FDL, which may be different from what you actually need or prefer. Using FDL, you can customize these views with the Farm View that will fit your needs.
Applying FDL to dbWatch
Here is an example. You need to create an overview showing Instances, Connection, and Status over one window. You may be thinking of something along the lines of the table below.
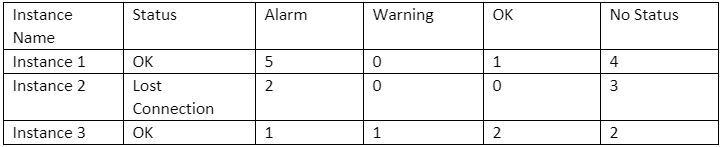
- - The numbers shown are arbitrary
When creating a custom FDL view, go to FDL Console and write your query in the Query area. Before doing that, open “FDL” in the upper section and left click on “New Console”. A separate window will appear. We will write our FDL query in that open query area. Change the execution method to Triggered (Execute > click Triggered) to manually execute our queries. Afterwards, use the query below:
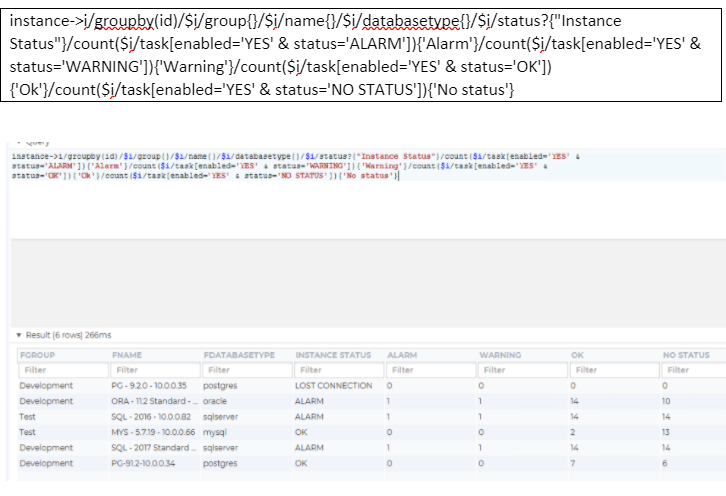
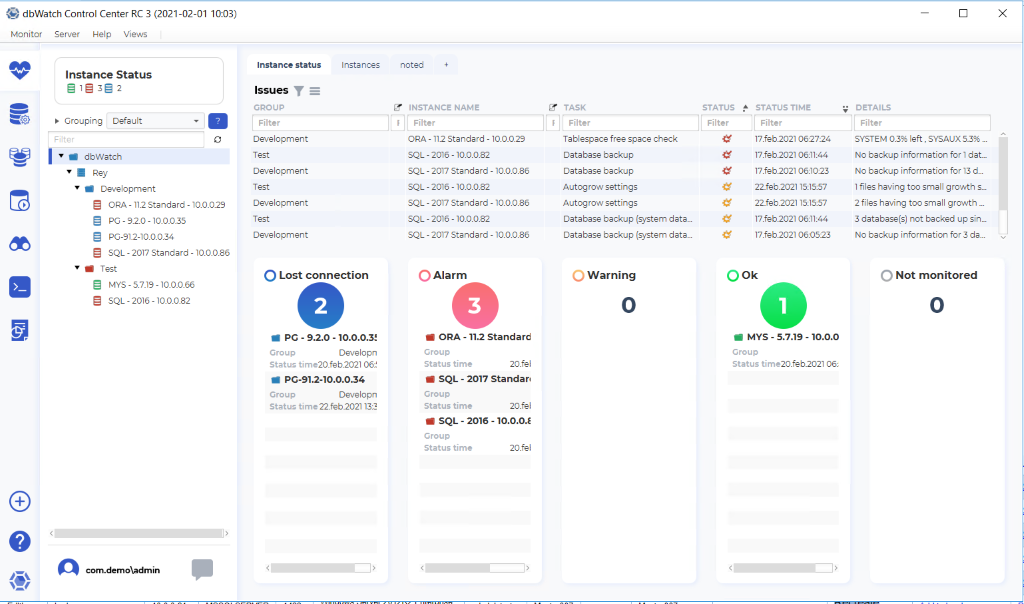
Figure 3
After showing you how the FDL query works, I will break it down and explain each segment it contains. Divided below are two components for more straightforward distinction.
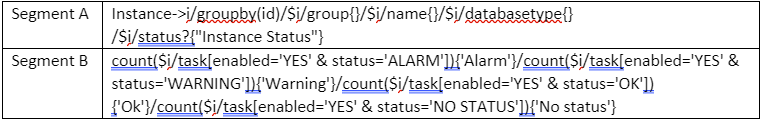
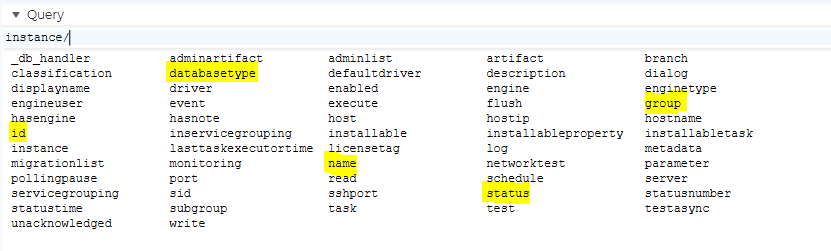
Segment A starts with the anchoring property Instance. The instance directly associates with its next five properties: id, Group, name, database type, and status. You can check the properties of the following property by clicking Tab after the back-slash(/) as seen below.
Groupby is similar to SQL’s equivalent of Group by where the query aggregates database on a reference point. ID is the most unique among the properties, it is an ideal candidate to reference our Groupby.
In Segment B, it aggregates data by counting the number of properties satisfying two of its defined filters (separated by an AND clause or &):
- - Alarm Should be Enabled
- - The second condition depends on if the status is ALARM, Warning, OK, or No Status
Once data is filtered, the count function counts all of those data in the instance level and returns a value.
Combining Segment A and Segment B, you get Figure 3. Alternatively, you can also beautify your FDL query by adjusting the column width, changing the instance status from text to images, and the like.
You can use the sample below with Figure 4 corresponding to the result for that FDL query.
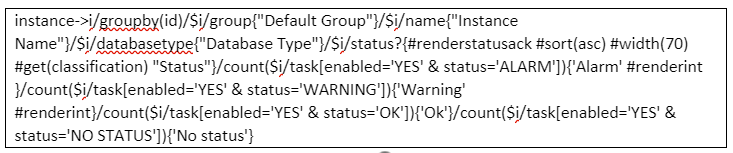
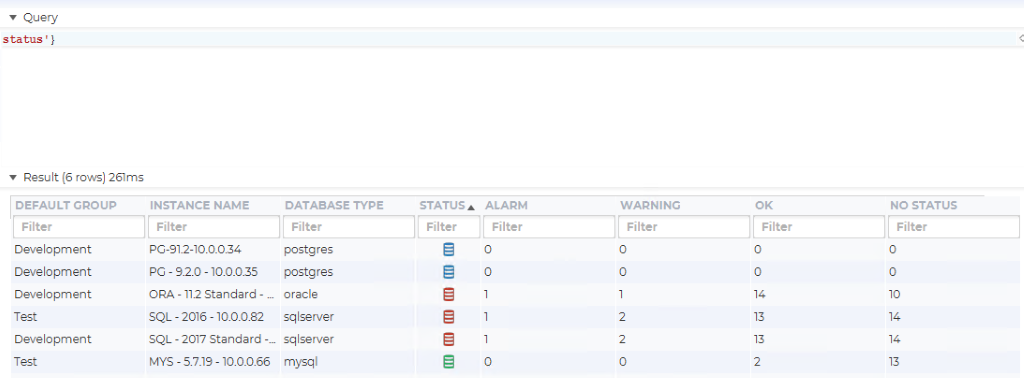
Figure 4
After configuring your query, go to View and click on Attach. The FDL Console view should be available on the left side of your dbWatch application.
Although we’re only using a couple of instances for demonstration, using Farm Data Language is invaluable in customizing your views. FDL is a straightforward query language to learn. With only a few lines of code, you are making your life easier.
---------------------------------------
If you have any questions or would like to know more about dbWatch, please contact us through the email: sales@dbwatch.com. If you have any questions about backups using FDL or Management console, you can directly contact the author through email: rey@dbwatch.com.
For more information, visit www.dbWatch.com or wiki.dbWatch.com
Other Blogs:
Create a customized database performance view in dbWatch
dbWatch Control Center for Managing Database Farms


