
If you are a database-conscious developer or even a database administrator, you probably know how important it is to keep an eye out on your database systems. However, you might also notice that performing such tasks manually might “eat” a whole lot of your time – so what do you do? Thankfully, we have a solution – you can employ database jobs by dbWatch!
----------------------------------------------------------------------------------------------------------
What Are Database Jobs?
Database jobs in dbWatch, simply put, are a bunch of small database advisors that let you unleash the full power of your database instances at any given moment – we have blogged about such things in the past, but in a nutshell, database jobs in dbWatch are small database advisors that come in a couple of “shapes” or “flavors” - they either return a status of success, alarm, or a warning. Those database jobs can be run, scheduled, configured, enabled, or disabled as well: dbWatch allows you to automate your database processes without your involvement.
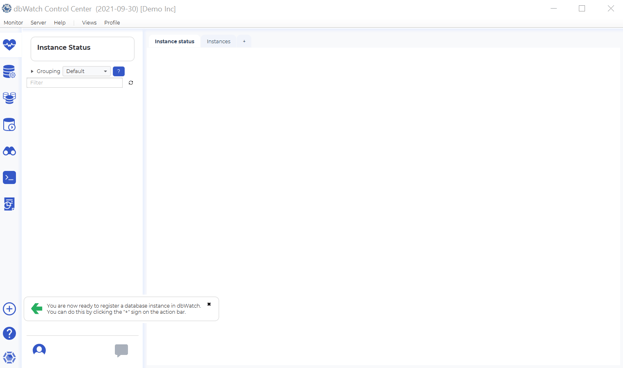
You will be able to observe the database jobs available for you to choose from once you import your database instance: go ahead, launch dbWatch and do that, and we will continue from there (we mean, you already saw the green arrow aiming towards the plus sign when you launched dbWatch, didn’t you?)
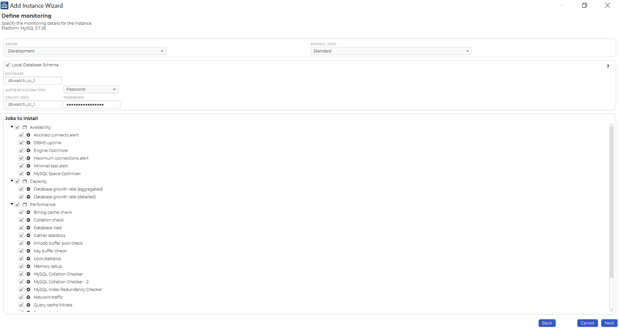
Once you’re done with deciding what kind of a database instance you want to import, check the database jobs you want to import (dbWatch has a couple of categories available for you to choose from – these range from availability to performance, oh, and also include capacity on the way – you need to ensure your disks are capable of performing well at all times, don’t you? Well, anyway, if you feel like some are unnecessary, you can uncheck some of them.
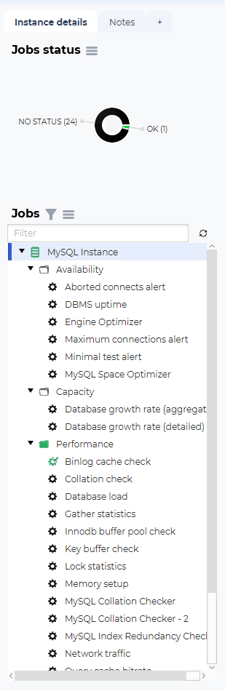
Once your database instance is ready to roll, head over to the left-hand side of dbWatch, expand a couple of options, and you will be able to see all database jobs listed below:
Some of these jobs, as already stated, relate to availability, some help improve capacity, some are targeted towards performance – choose what you want to take a look into, then right-click some of them: you will be able to see that database jobs can be run, configured (that is, modified), also disabled:
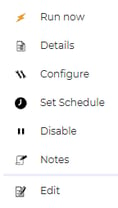
For example, click the Configure option to be able to modify the database job towards your desires: in this case, keep in mind that various database jobs will have different options available for you to choose from – don’t fret if you don’t understand something though, click the “?” option and dbWatch will explain what the option does. Here’s an example:
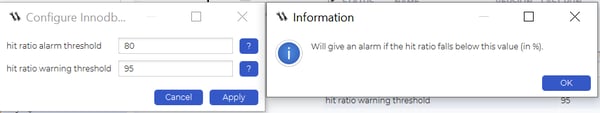
Once you’re satisfied with the options you have set, you are free to go – click Apply, then right-click the job again and run it.
Once you have successfully run your database job, take a look at the job execution statistics:
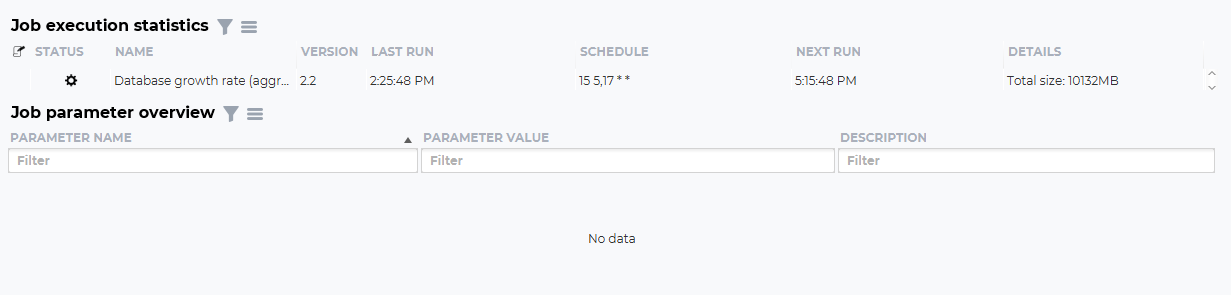
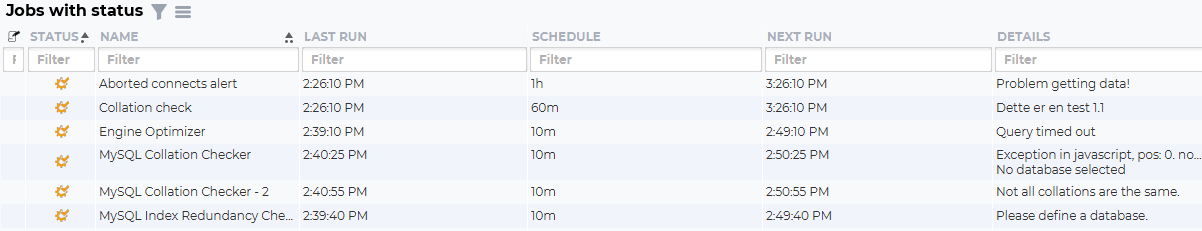
In this case, you will also be able to see when the database job was last run, what it’s scheduled, when it’s scheduled to run for the next time, and its details (what output the database-related job provides.) In this case, we see that we ran the database growth rate job, and it provided us with the total size of our databases – in this case, it would also be nice to keep an eye out for the job status too – the settings gear in green means that the job ran successfully, if it’s orange there were some errors, so you would probably need to re-configure it and rerun it again:

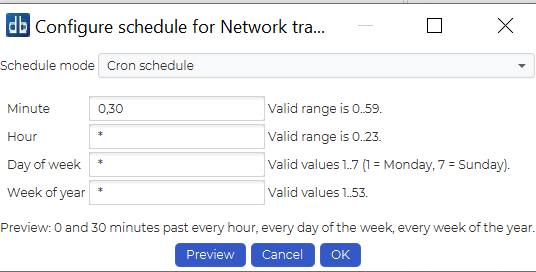
Remember how we told you that jobs can be scheduled – yeah! Just click the Schedule option and you will also be able to configure the schedule for a given database job – cron-style:
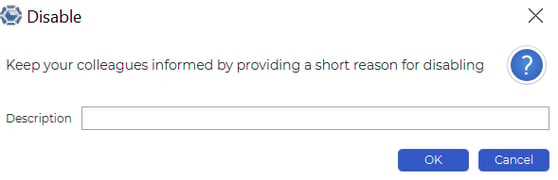
Database jobs can also be disabled, and in that case, you can also keep your developer colleagues in link by providing them with a short reason why did you decide to disable such a database job:
Once you have disabled a certain database job, refresh your database jobs, and you will be able to see that it will be outlined in grey:

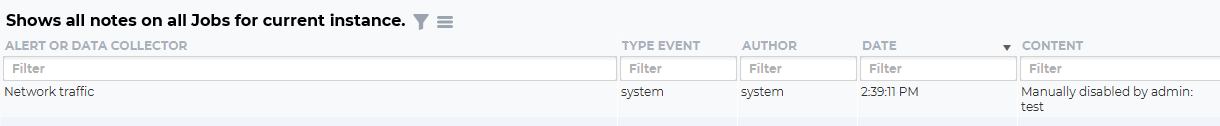
Your colleagues could then head over to the Notes section of dbWatch (to the right of instance details) and see the reason why you disabled the job (in this case, “admin” is the username of a given user and “test” is the reason):
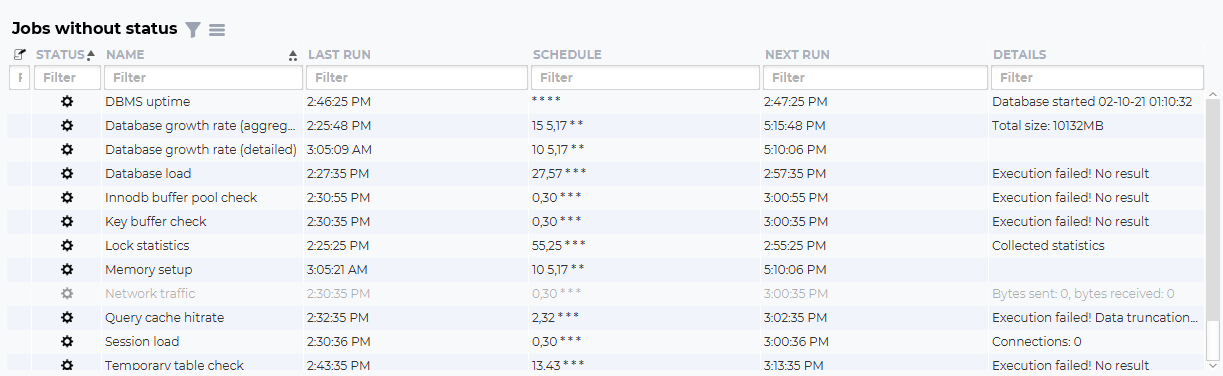
Come back to the Instance details section, and you will also be able to see that dbWatch will display all your jobs with a given status – observe the Details section and you will be able to see the messages relevant to them too:
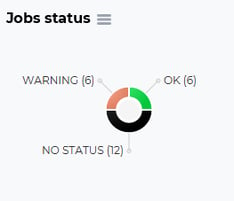
Observe the top left side and you will also be able to see the status of your jobs:
Oh, and dbWatch will also display all of the jobs without any status too – scroll through them and run a couple if you want – running them will improve your database performance, capacity, or availability, depending on which database job you find yourself running. Can it get easier?
“Is that it?”, - we hear you saying. No, really not – dbWatch can also let you run your SQL queries or FDL queries (meaning that you run queries on your database, just with language specific to dbWatch) or also provide you with colourful graphs relevant to the performance of your database instances (you will also be able to see the amount of logical reads, etc.)
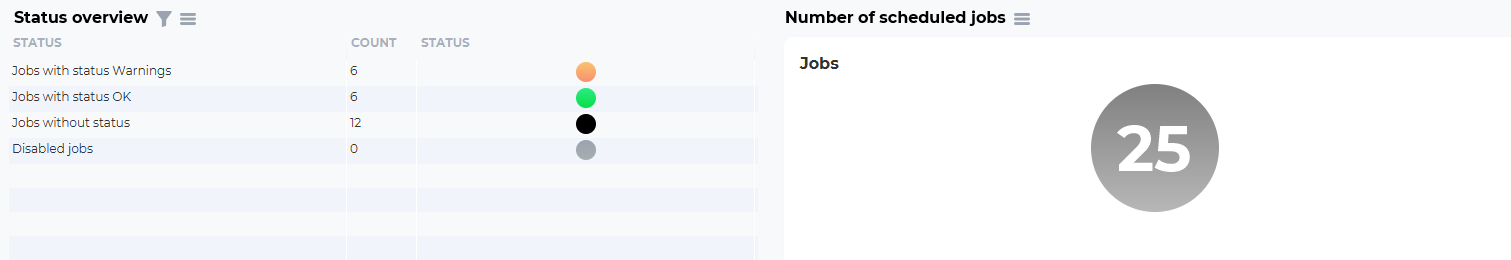
As far as jobs are concerned too, you will be able to see a status overview with the amount of jobs with a proper (“OK”) status, the amount of jobs with a warning, the number of scheduled jobs, or last 20 jobs that have been executed:
We hope that this blog has provided you with a little insight into the world of dbWatch and specifically its jobs relevant to databases. We hope you stick around for more content and try the product out – after all, there’s a support team that can be reached at the snap of a finger, so what are you waiting for? Try it today!
-------------------
Other blogs:
Running SQL Queries with Tools - dbWatch Control Center edition
dbWatch multi-domain: A practical approach for our Oracle Database and SQL Server Database Farm
SQL Server Uptime - When do you restart your SQL Server Instances
-------------------
About the Author:
Lukas Vileikis is an ethical hacker and a frequent conference speaker.
Since 2014, Lukas has found and responsibly disclosed security flaws in some of the most visited websites in Lithuania.
He runs one of the biggest & fastest data breach search engines in the world - BreachDirectory.com, frequently speaks at conferences and blogs in multiple places including his blog over at lukasvileikis.com.


