
If you have every worked with databases, you are probably already familiar with a couple of concepts including SQL queries, performance, and also sessions. Today we will provide a little more information regarding their monitoring in dbWatch.
----------------------------------------------------------------------------------------------------------

What are Sessions?
Sessions are frequent guests in the database world. Sessions are synonyms to connections – when we connect to a database, we usually initiate a SQL session. When we log in or out of a website, we either start or destroy a session too!
As we click a button with some sort of functionality (for example, if we want to put an item into our shopping cart), we probably initiate a session. Sessions help servers keep track of information being sent back and forth – sessions usually expire when we close a page or our browser , if we’re using one.
Sessions in Databases
If you are a database administrator, you are probably monitoring a couple of things as it is. You are probably monitoring your query performance, replication statistics, the statistics of your database storage engines, whether your databases are up or down, how much data is written to your database, and so on. While these things are going on inside of your databases, each of them either opens or closes a session.
Keeping an eye out on both application and database sessions is essential because of a few key things:
- - Monitoring the sessions that are open and that are closed might help us figure out some issues in our application code – for example, if our users click the log out button, but are never logged out and instead are only redirected, perhaps a session is opened, but never destroyed upon the logout button click? Most likely.
- - If we are opening a connection (session) to our database, and the database responds with “Too many connections” instead, perhaps we are never terminating sessions either? Time to check before our actions cause downtime and issues for our business or customers.
- - By monitoring the number of total and active sessions inside of our database, we can know how session load is distributed throughout a given timeframe. We will get into that in a second.
Session monitoring can, of course, be accomplished by using dbWatch. MySQL, for example, uses one thread per one connection – if all of your available connections are in use, you will get a “Too many connections” error. On the other hand, if you want to see all of the sessions that are currently initiated in your database you use the SHOW PROCESS LIST; command and kill the sessions that are unnecessary, etc.
However, we have addressed some of that in a previous blog, so now we’re going to show you how you should manage your database instances instead first. All of that is pretty simple – simply click Monitor, then Management in dbWatch. This is what you will most likely see:
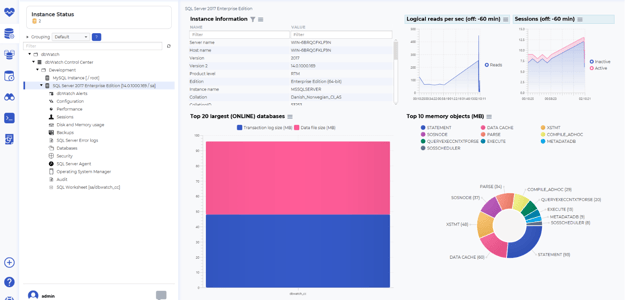
As you can see, dbWatch provides you with a lot of (colourful, should we say) information regarding your database instances which can help with monitoring: first of all, dbWatch provides you with some information directly relevant to the instance itself (you can observe the settings that are set and change them if some are not necessary), it provides you with the top 20 largest online databases, the graphs are also used to define logical reads or sessions, should they be active or not.
The coloured circle, in this case, also depicts memory objects. Oh, and have you glances at the left hand side? dbWatch has a bunch of options there, too. For example, the security section has a subsection dedicated to logins, the sessions section has a subsection dedicated to disk and memory usage, etc:
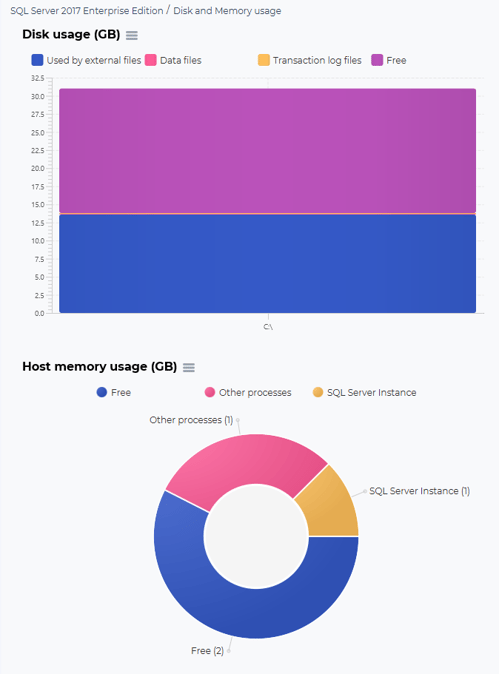
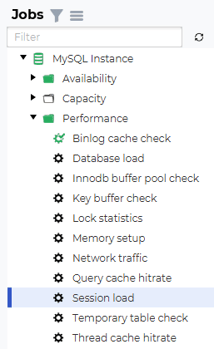
In the disk and memory usage section, for example, you will be able to see what processes consume the most of host memory usage. However, while dbWatch has a lot of features and while some of them might be directly related to sessions, we are mostly interested in sessions themselves. dbWatch has a session load job as well - this job displays relevant session statistics so you can get an indication of how your database session load is distributed during a day. If you are using MySQL instances connected to your database session load is distributed during a day. If you are using MySQL instances connected to dbWatch, you make use of this job: expand the Performance section, then hover the Session load job:
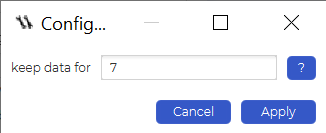
This job doesn’t have a lot of options you can configure, although it has one – you can configure the number of days you want the system to keep data for:
Finally, if you want to see of how your database sessions are doing, click Run now and click Details. You should see something like the following:
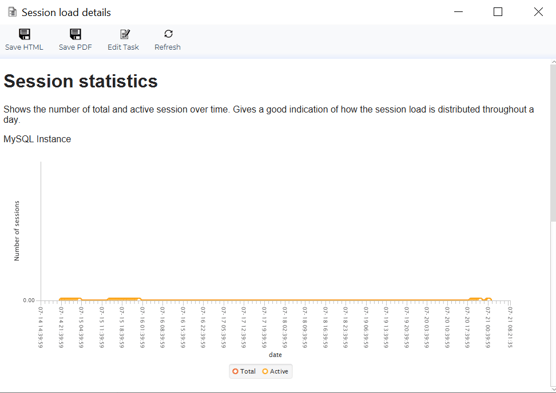
Here the red dots represent the total amount of sessions in your database, while the orange dots represent the number of active sessions in your database. If you see that the amount of active sessions is going through the roof, it might be time to double- check your database configuration: a glance at my.cnf and consider incrementing the max_connections variable in order to stop MySQL or MariaDB from going crazy.
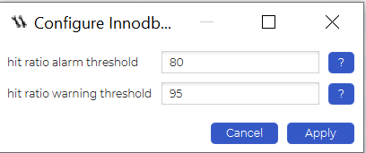
With that being said, dbWatch can help you monitor a number of different database-related things too: for example, the InnoDB buffer pool checking job lets you configure the hit ratio alarm and warning thresholds which can be helpful if you are monitoring your InnoDB engine performance – these thresholds will be triggered if the hit ratio of your InnoDB instances will fall below certain specified percentages:
If you are using SQL Server, Oracle, Sybase, or PostgreSQL, dbWatch has you covered too. For example, here are some of the database jobs available for SQL Server:
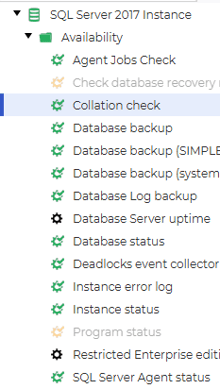
As you can see, the list of jobs available for use in the database Availability section alone (dbWatch has Availability, Capacity, and Performance sections) is far more extensive, and that’s partly because MySQL is still in a beta version for dbWatch, but don’t worry – it will be up to par with SQL Server sooner than you might think!
Summary
Sessions in databases are as important as monitoring the performance, indexes, partition usage, and everything in between. If you exceed the limit of max_connections defined in your my.cnf file (if you are using MySQL), you might be in trouble because no account will be permitted to connect to your database in such a scenario. In order to avoid such a scenario, consider using dbWatch to monitor your database performance and making use of the Session load job available under the Performance section for MySQL and MariaDB instances – use this job properly and your MySQL and MariaDB database instances should be on a path to better performance very quickly.
-------------------
Other blogs:
------------------
About the Author:
Lukas Vileikis is an ethical hacker and a frequent conference speaker.
Since 2014, Lukas has found and responsibly disclosed security flaws in some of the most visited websites in Lithuania.
He runs one of the biggest & fastest data breach search engines in the world - BreachDirectory.com, frequently speaks at conferences and blogs in multiple places including his blog over at lukasvileikis.com.


