
About the Author:
Lukas Vileikis is an ethical hacker and a frequent conference speaker.
Since 2014, Lukas has found and responsibly disclosed security flaws in some of the most visited websites in Lithuania.
He runs one of the biggest & fastest data breach search engines in the world - BreachDirectory.com, frequently speaks at conferences and blogs in multiple places including his blog over at lukasvileikis.com.
----------------------------------------------------------------------------------------------------------
Why InnoDB?

InnoDB is one of the most widely used storage engines in MySQL. This storage engine is known as a highreliability and a high-performance storage engine and some of its advantages include supporting foreign keys and row-level locking. This engine is especially widely known for following the ACID (Atomicity Consistency Isolation Durability) model – in general, ACID ensures that database transactions are processed reliably and warrant data validity despite errors, power outages etc.:
- Atomicity means that statements in a transaction must operate as an indivisible unit meaning that their results must be seen collectively or not seen at all.
- Consistency is handled by MySQL’s logging mechanisms.
- Isolation – row-level locking provided by InnoDB.
- Durability means that InnoDB maintains a log file that tracks all changes.
The explanation above should give you a pretty good idea of how powerful InnoDB really is, but in order to keep the engine running as smooth as butter, you need to understand how is it monitored.

Why Monitor?
Before we actually tell you how you should monitor the performance of your InnoDB engine, we should probably answer the question "why do you need to monitor it in the first place?". In general, monitoring the performance of all of your engines (not only InnoDB) can come in handy if you want to make sure your database always is in tip-top shape and also to avoid issues that might arise in the future due to mismanagement of data or other things.
What do You Need to Monitor?
When it comes to InnoDB, there’s a couple of things that you need to keep in mind (we won’t list everything here, but this list should give you an idea of just how powerful InnoDB really is):
- The data residing in InnoDB engines is situated around the ibdata1 file which stores all data relevant to InnoDB including the data and indexes of InnoDB tables, table metadata, MVCC data, the doublewrite buffer and the insert buffer.
- One of the most important parameters in InnoDB is the innodb_buffer_pool_size parameter – this parameter acts as a memory buffer that InnoDB uses to cache the data and indexes of its tables. For the best performance, the value of this parameter should consist of 50- 80% of the available RAM on your system (keep in mind that you need space for the processes running in the OS aswell)
- The innodb_log_file_size parameter defines the size of InnoDB log files.
- The innodb_log_buffer_size is used to write to the log files on disk.
As you can probably tell, you should try to monitor at least some of those things because they are absolutely crucial for InnoDB to function properly – now we will look into how you can monitor one of the most important parameters of InnoDB – the innodb_log_buffer_size – in dbWatch.
How do You Monitor the InnoDB Engine in dbWatch?
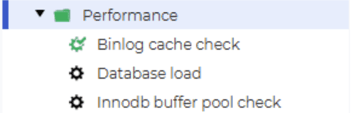
In general, to monitor the InnoDB engine in dbWatch, run the InnoDB buffer pool check job:
This job can be configured with a hit ratio alarm threshold and a hit ratio warning threshold. The hit ratio alarm threshold will give an alarm if the hit ratio falls behind a certain specified percentage that you specify and the hit ratio warning threshold will give a warning if the hit ratio falls below a certain
percentage specified:
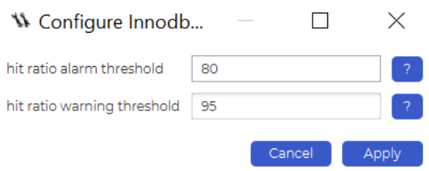
This job is very useful when monitoring InnoDB because by using it, you can verify that tables running InnoDB in your MySQL instance are actually doing an effective job and InnoDB is used properly. If the hit ratio falls behind a certain low percentage, it might be time to check your my.cnf configuration.
Summary
Monitoring InnoDB performance is one of the primary ways to ensure that your MySQL instances stay in the best shape possible. Tools developed by dbWatch can help you ensure that your InnoDB engine is used effectively and help you push InnoDB to its limits. Contact dbWatch now!
Other Blogs:
Monitoring MyISAM Performance with dbWatch – a Guide
From SQL Instance Management to Database Farm Management


