Chad Pabalan is a Pre-Sales Engineer for dbWatch and a DBA specializing in SQLServer high availability setups and disaster recovery planning and configurations. He is an AWS Certified Solutions Architect Professional, a cloud enthusiast specializing in architecture and designing scalable, high available, and fault-tolerant systems on AWS Cloud.

Problem
I want to view the performance of my SQL Server indexes across the database farm and determine the top instances by index disk usage. I also want to look for servers that encounter problems when running the update index statistic job.
Solution
dbWatch Control Center can monitor your Microsoft SQL Server's index usage rate and perform database index maintenance to make sure that your servers are running smoothly.
In this blog, you will learn how you can analyze your database indexes within your database farm and determine which instance has its SQL Server maintenance plans or index maintenance jobs running longer than the usual by using dbWatch Control Center features.
Example 1: Index Analyze Statistics Job
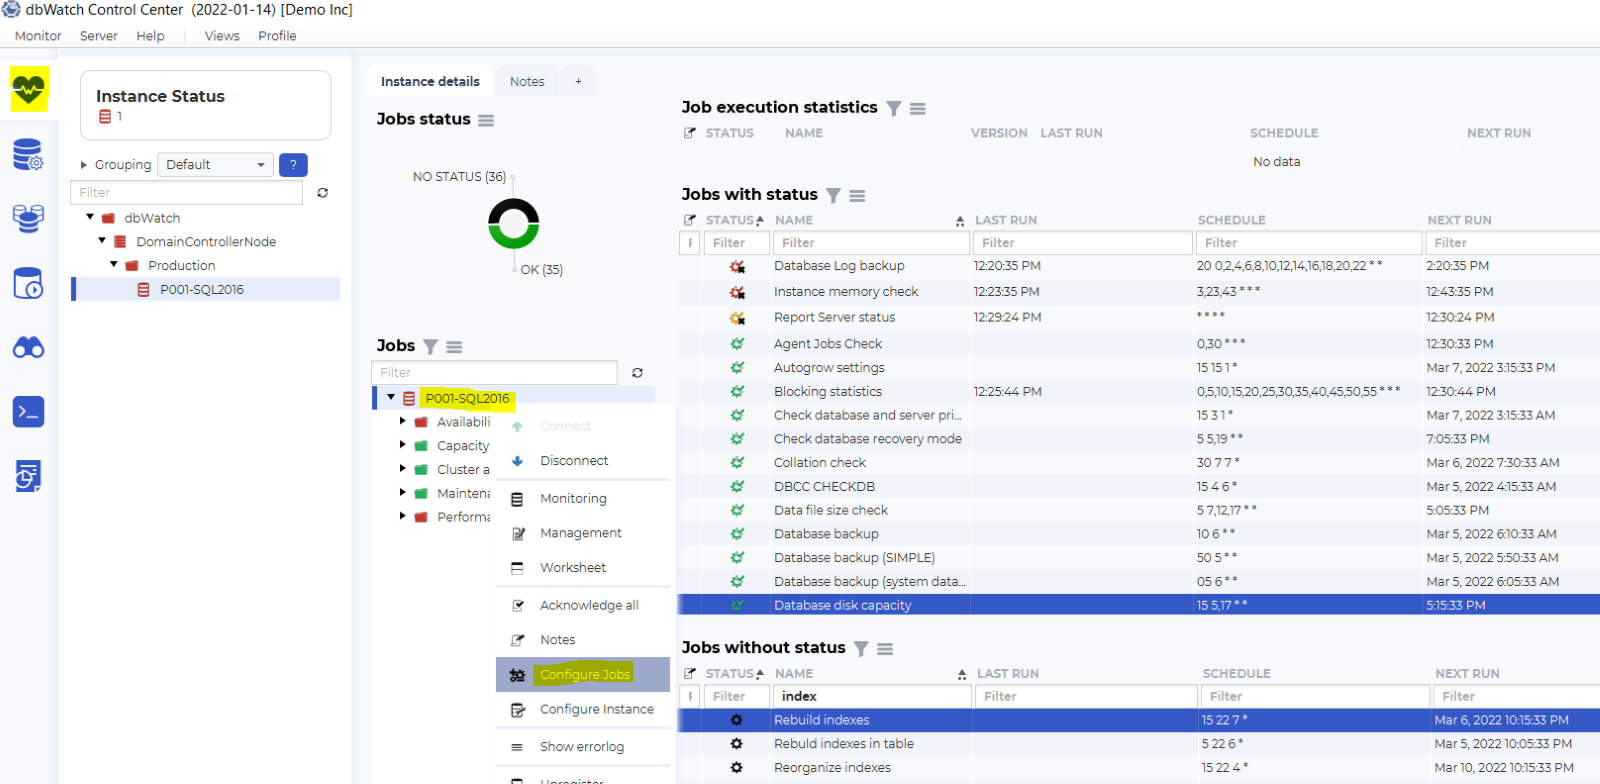
On the monitoring view, right click on your SQL Server instance. Click Configure Jobs.
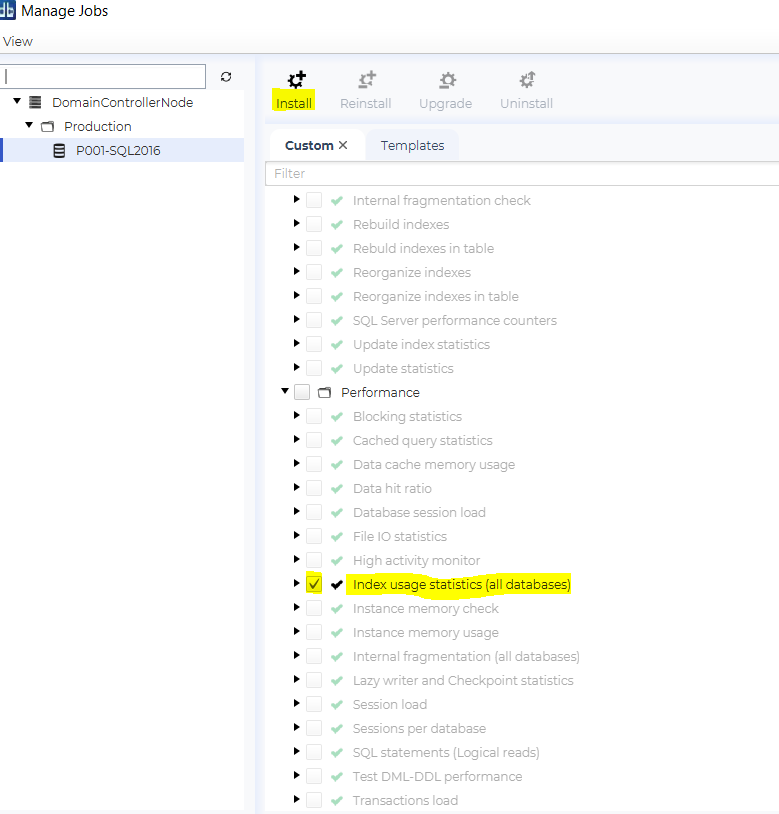
A new window will appear, tick the job Index usage statistics (all databases). Click Install.
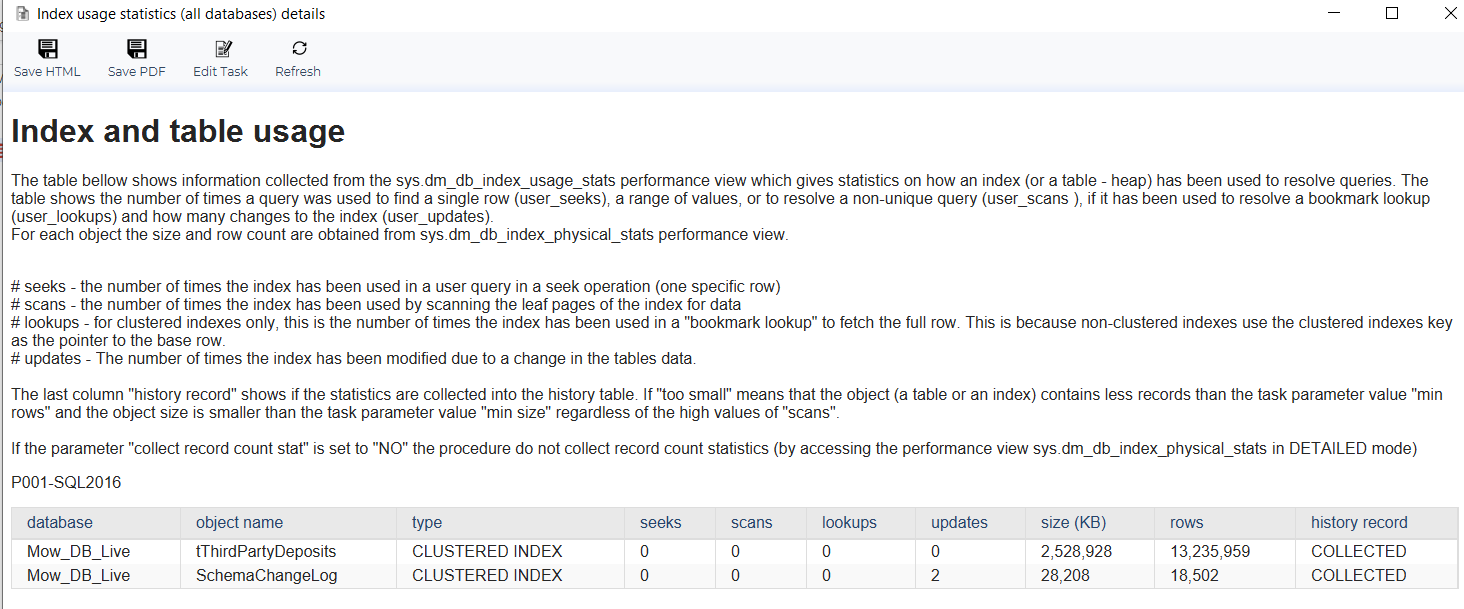
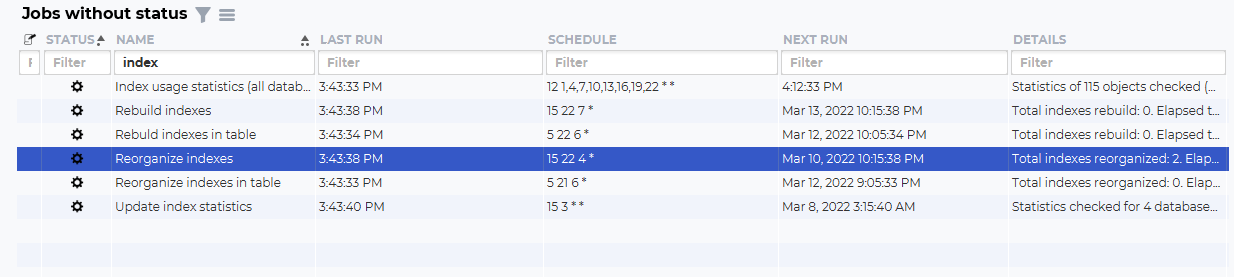
As seen in the screenshot below, this job collects database index and table usage, shows information about the object/table name type of index total seeks and scans. It gives you information about how big your tables are and if it frequently uses an index scan or index seek. Ideally, you would want your indexes using an index seek.
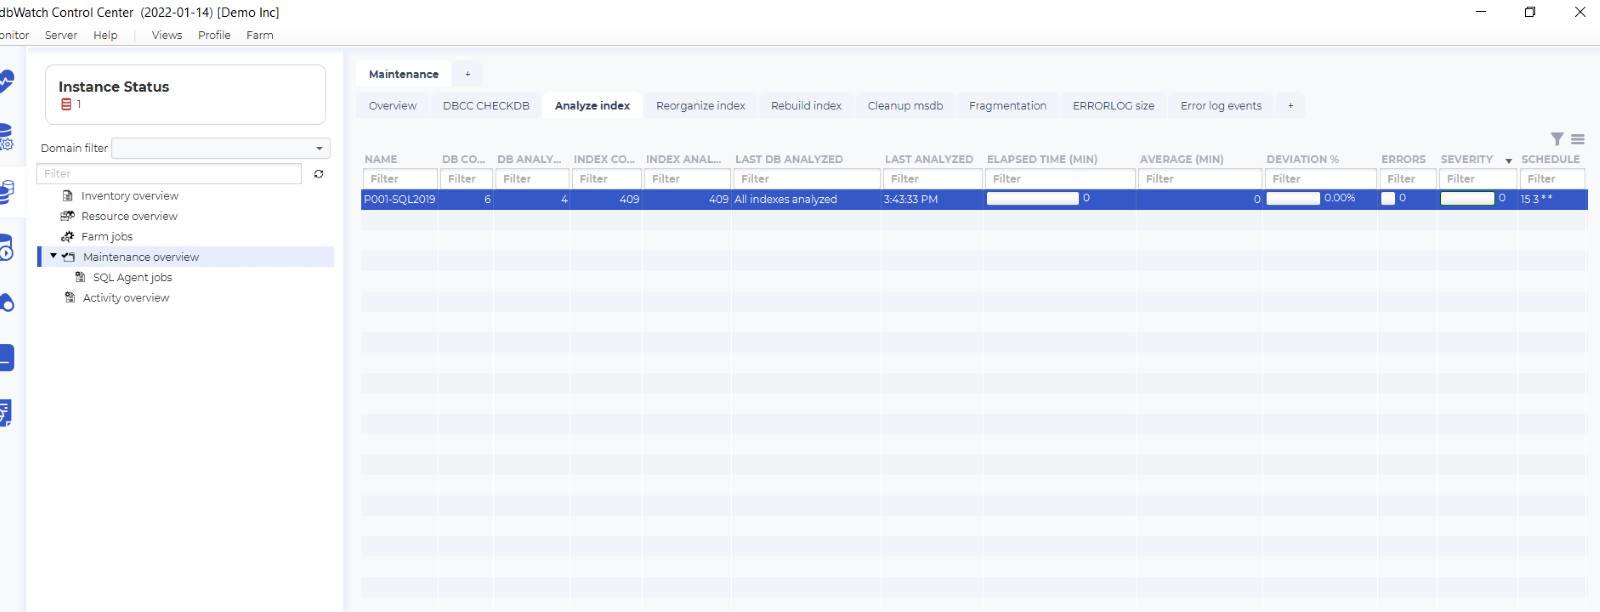
In the job - Update index statistics, within this view you will be able to see useful information such as the database name, database index count per database and total indexes (clustered/non clustered) analyzed per database. It will also show you the number of errors within the execution of the update statistics task, if there are any.
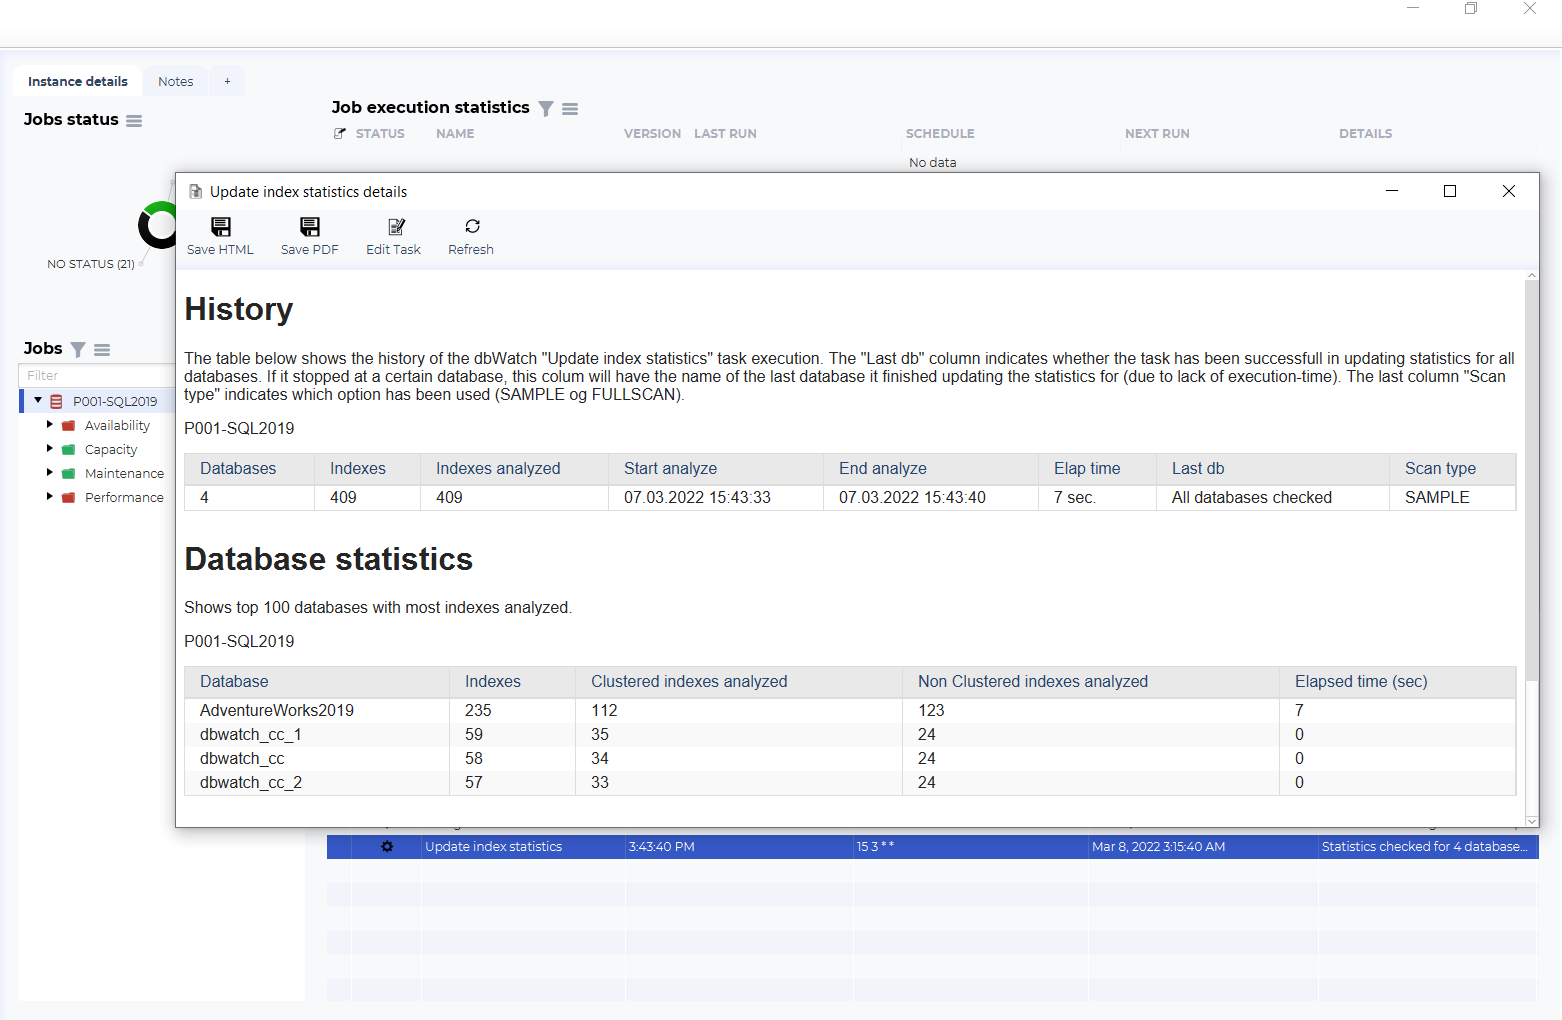
In this view you can easily sort the columns in ascending or descending order. This will help to determine which instance within the database farm has the longest/shortest elapsed time when analyzing indexes, this is useful if some maintenance jobs are taking a longer time to finish than usual.
An example application of the jobs shown is when you have a scheduled index rebuild job weekly, from Week 1 to Week 7 your average elapse time was around 15-20 mins. to finish. But suddenly, when you look at the dbWatch Control Center view shows that this week (Week 8) it took 80-90 mins. to finish. The average time increased 4 times its usual execution, this tells you that there is something going on within your SQL Server indexes - from there on, you will start investigating the cause of the problem.
Example 2: Index Reorganize and Rebuild View
dbWatch Control Center also provides you with index maintenance jobs such as Index rebuild and reorganize.
This view displays the index rebuild/reorganize statistics. Here you will see the list of instances and the number of databases checked within the instance, and it also shows which databases was rebuilt and which was ignored.
In this view you will be able to sort the column to determine which instance consumes the most disk space.
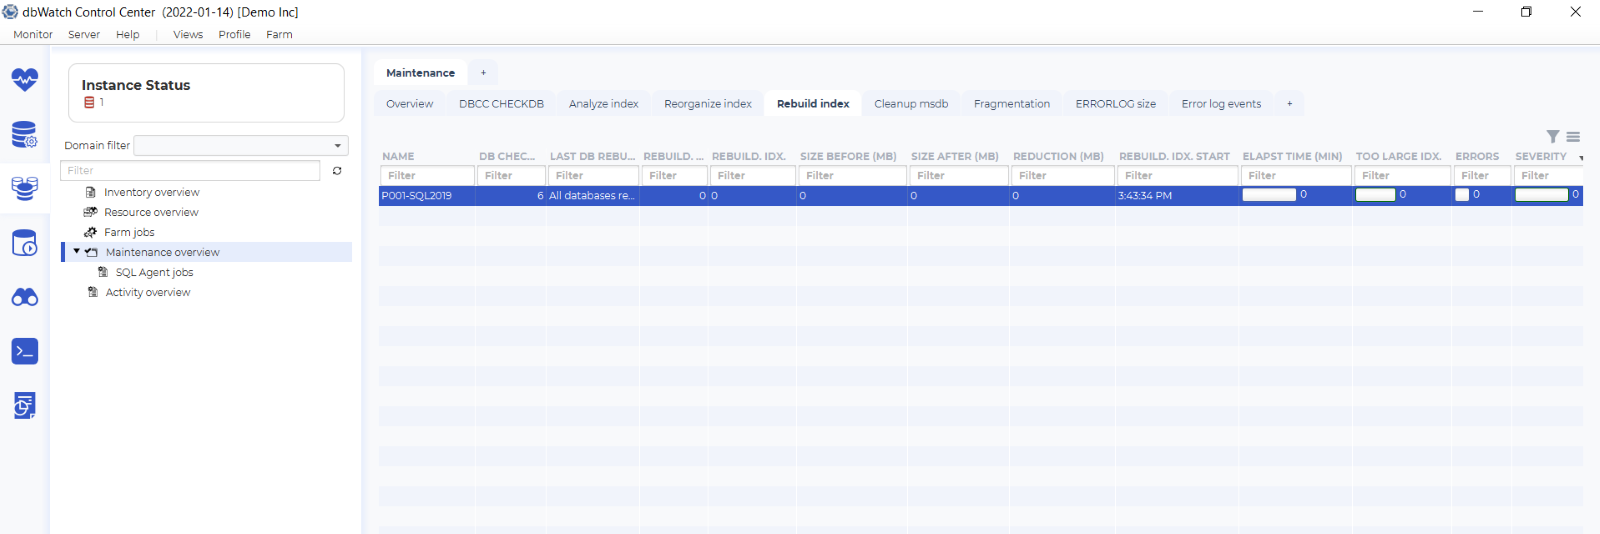
The important part of this view is the size before and after the index rebuild took place and the disk usage reduced by the operation.
If you right- click on a selected instance, you have an option to execute the task and start an index reorganize/rebuild task on the instance databases' or configure the task and its schedule.
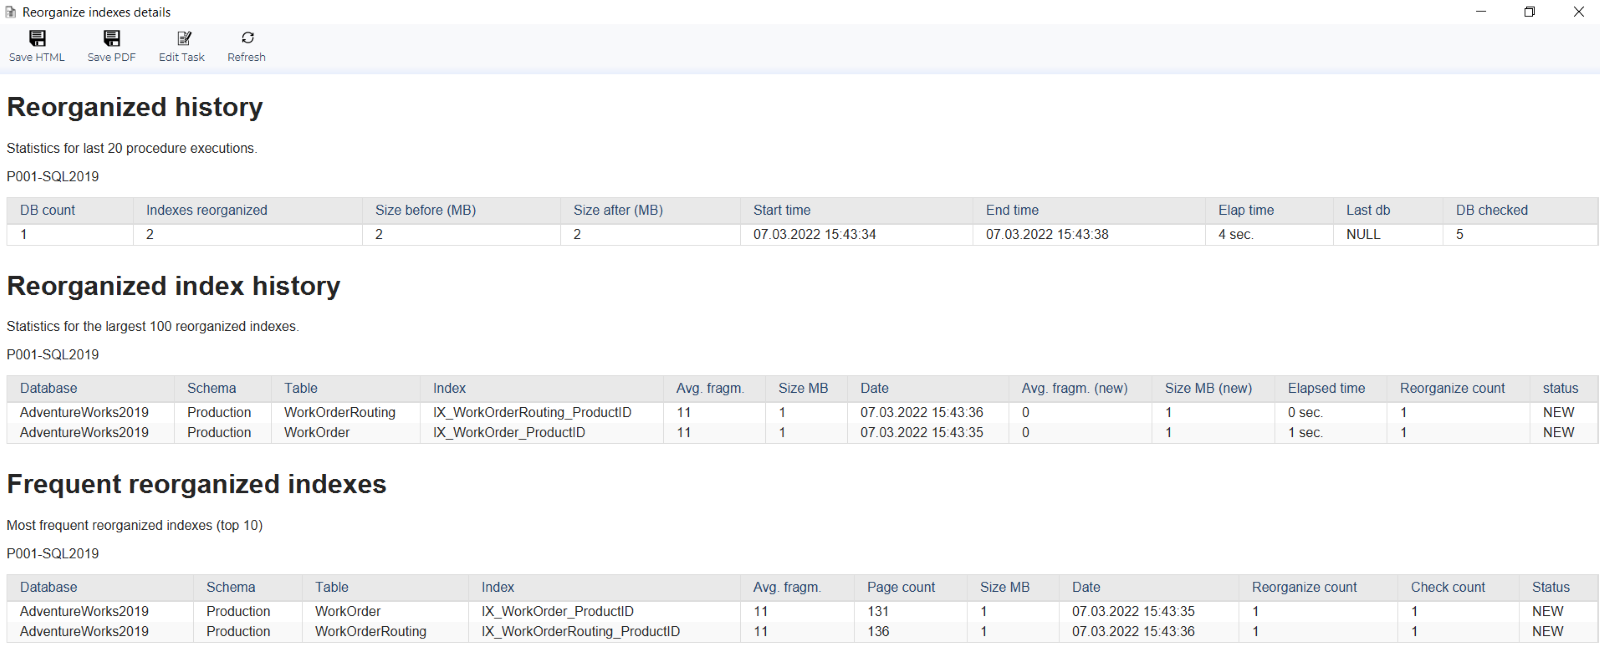
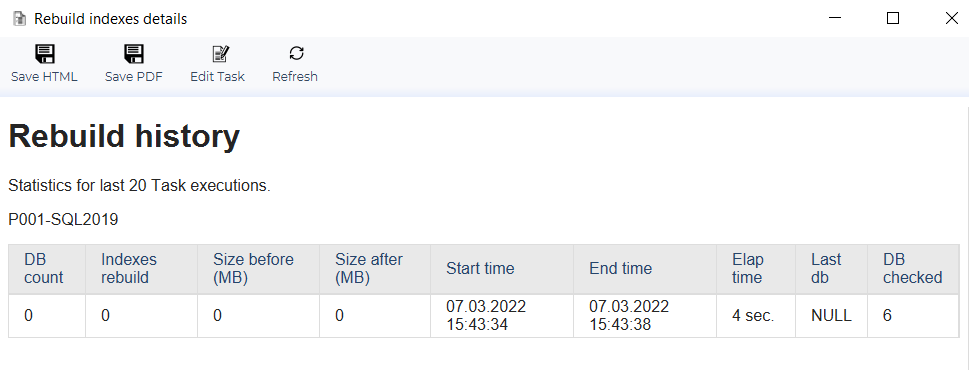
If you choose Details, you will see a report regarding the history of the reorganize or rebuild execution within that instance, it also shows the information about the table and index fragmentation average and the disk usage before and after the reorganize or rebuild operation.
With the following examples provided, you will be able to determine which instances has the biggest database index disk usage within your database farm. You will also be able to assess if a certain index operation schedule should be adjusted based on the performance and other details shown in the reporting view.
With dbWatch Control Center, database admin’s can now keep track of their SQL Server indexes and their performance. As a DBA, you can now analyze how your database indexes are being used in your environment and plan on how you will maintain these SQL Server indexes efficiently.
dbWatch Control Center assists database administrators to efficiently run their databases, from proactive monitoring of database performance to the management of tasks.
You can try dbWatch Control Center today. Use this link to download a version of dbWatch Control Center that can monitor up to 5 instances for 6 months for free: dbWatch Control Center free license
If you have any questions or you would like to know more on how dbWatch can assist you in your current enterprise database monitoring and management situation, feel free to contact me directly: chadwick@dbwatch.com or email presales@dbWatch.com
For more information, visit www.dbWatch.com or the dbWatch wiki pages
#DatabaseMonitoring #DatabaseIndex #DatabaseIndexMaintenance #SQLServerIndexes #SQLServerDatabase #DatabaseManagement #DatabasePerformance #MicrosoftSQLServer
----------------------
Other blogs:
Working with MySQL vs MariaDB - What's different?
Why do Developers Automate Database Processes?


