In large Oracle database environments, the usual problems that an Oracle database administrator encounter daily are long running queries, multiple blocking processes, that eventually ends into a deadlock transaction, high resource consumption of a query that causes performance degradation and other causes such as poor query design and poor index usage, instead of throwing hardware to the performance problems happening within the Oracle environment.

A good Oracle DBA should properly set a good proactive Oracle database monitoring solution in place and work to analyze the performance of his/her Oracle databases, identify the root cause of the problem and respond with changes to improve the process/query that caused the performance degradation.
With dbWatch Control Center, Oracle DBA’s can easily analyze those different factors mentioned that causes impact in their environment, using the different performance counters and statistics available they can form a solution to improve poor performing processes.
Starting with one of the most common problems that Oracle database administrators encounter daily: long running queries. You can view queries that are currently running by going to the instance which you want to monitor. Expand performance, Choose Active sessions.
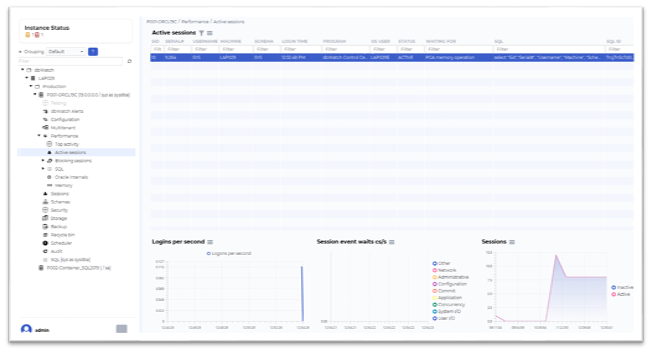
The view displays the active processes where it shows the initial login time of the query or the start time, to view the SQL explain plan and other statistics information, just right click on the session and choose the information you wish to see.
Oracle DBAs can also look at query statistics by expanding the SQL menu on the left side. It will display the top 20 queries by elapsed time, by average IO, by CPU or by executions.
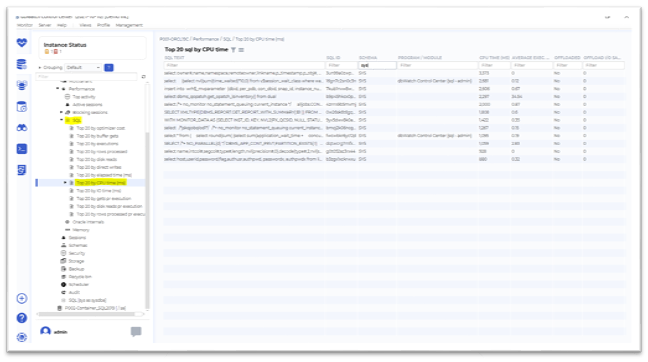
Filter out the top processes based on its query text, execution count, max elapsed time, average elapsed time and the log create date.
With the following data available Oracle database administrators’ will have a good idea about which query needs to be optimized based on its performance with regards to its execution time and resource consumption.
Another problem that Oracle DBAs encounter are multiple blocking processes.
In this example we will simulate a blocking transaction in a test machine.
We have a simple insert statement
create table EMPLOYEE (ID INTEGER, FNAME VARCHAR (10), LNAME VARCHAR (10));
insert into EMPLOYEE values (1,'John','Stockton');
insert into EMPLOYEE values (1,'John','Marston');
commit;
select * from EMPLOYEE where LNAME='Marston' for update;
Execute the query.
And open another session, select the table: Employee
update EMPLOYEE set FNAME='Jon' where LNAME='Marston';
We now have an active blocking process.
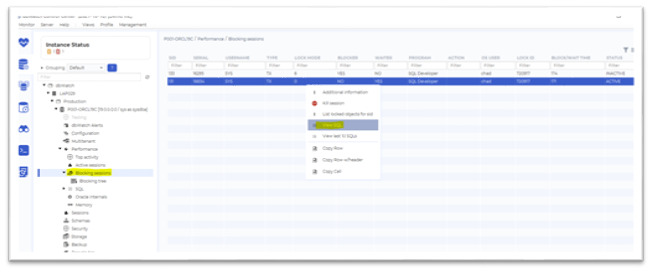
Using dbWatch Control Center you can view blocking processes within your Oracle database. Go to the Management Module under Performance -> Choose Blocking session
In this view shows the simulated blocking process it displays various information regarding the processes that block each other. We have the session ID, username/OS user, blocker, status, command and other relevant information. If you right click the session, you have an option to kill the process and view the SQL query of the session.
To view the blocking history of your instance
Go to the Monitoring Module-> Select instance(P001-ORCL19C) -> Performance > Choose blocking detector -> Right click and select Details.
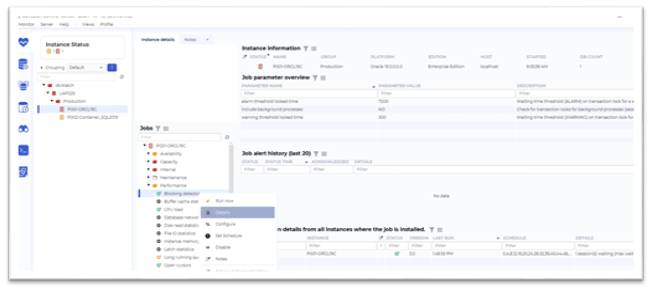
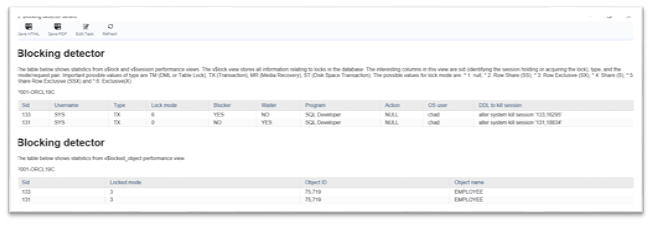
In this window shows additional information about the previous blocking processes.
It displays the process, which was blocked and the process that blocked it, session history login info, program name, database name, SQL command for both processes.
With the detailed report coming from the dbWatch Control Center monitor, Oracle DBAs can act to optimize queries that frequently block other processes to avoid multiple blocking scenarios that can cause database timeouts in the future.
And last on the list is CPU Intensive queries, using dbWatch Control Center DBAs can analyze - CPU usage trend and determine when the instance is at its peak when it comes to resource usage.
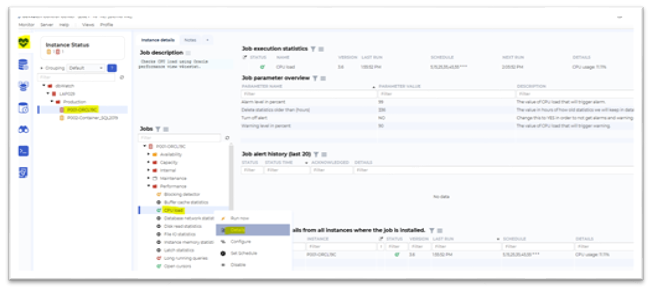
Go to Monitoring -> Choose instance(P001-ORCL19C) -> Expand Performance-> Right click CPU Load to view more information regarding the instance CPU peak hours.
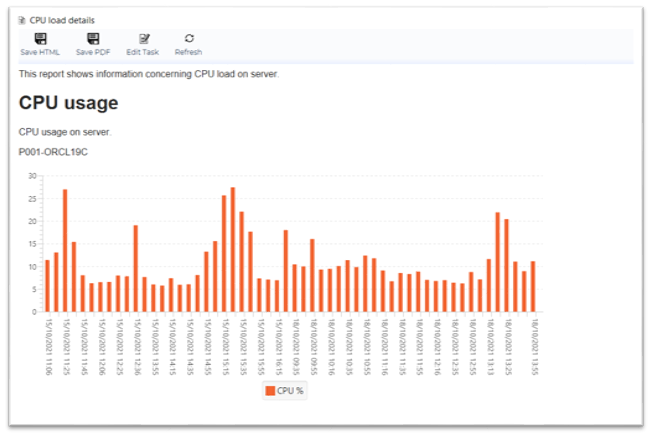
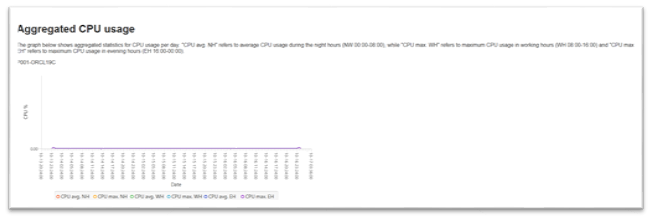
In this window shows the CPU utilization history chart which shows CPU usage for the last 2 hours, aggregated CPU usage divided into CPU Max Night Hours between 12midnight to 8am, CPU max working hours between 8am to 4pm, CPU Max evening hours between 4pm to 12midnight.
With dbWatch Control Center, Oracle DBAs can now monitor their resource usage trend and analyze the peak hours in their database environment based on the charts available.
dbWatch Control Center assists Oracle DBAs to efficiently run their databases, from proactive monitoring of database performance to management of Oracle tasks.
With dbWatch Control Center as your partner in monitoring and managing your Oracle databases helps you achieve the following:
- Proactive monitoring dashboards display a health overview of all databases within your data center. Provides you with the necessary information for you to take proactive action against issues
- Complete information of your Oracle databases performance when it comes to CPU load, long running queries, blocking sessions.
- Maintains proactive monitoring and ensures high availability of your servers.
- Delivers real-time alerts for performance metrics and identify which databases are having performance problems
You can try dbWatch Control Center today. Use this link to download a version of dbWatch Control Center that can monitor up to 5 instances for 6 months for free: dbWatch Control Center free license
If you have any questions or you would like to know more on how dbWatch can assist you in your current enterprise database monitoring and management situation, feel free to contact me directly: chadwick@dbwatch.com
For more information, visit www.dbWatch.com or the dbWatch wiki pages
#DatabaseMonitoring #Oracle #OracleDatabaseMonitoring #SQLDeveloper #DatabaseReporting #DBA #DatabaseManagement
--------------------
Other Blogs:
Database Security with dbWatch: A Guide
Breaking in as an Accidental DBA in the world of database administration


