
About the Author:
Lukas Vileikis is an ethical hacker and a frequent conference speaker.
Since 2014, Lukas has found and responsibly disclosed security flaws in some of the most visited websites in Lithuania.
He runs one of the biggest & fastest data breach search engines in the world -
BreachDirectory.com, frequently speaks at conferences and blogs in multiple places including
his blog over at lukasvileikis.com.
----------------------------------------------------------------------------------------------------------

DevOps, as you probably already know, refers to a set of practices that combines software development (that’s the Dev in DevOps) and IT operations (the Ops in DevOps) aiming to shorten the lifecycle of system development while at the same time providing high and reliable software quality and also continuous delivery. In this blog post we will tell you how you can go about solving database issues encountered in DevOps operations with dbWatch.
What Database Issues do DevOps Engineers Face?
Before we actually tell you how you should solve your database issues with DevOps, we should probably try and understand what database issues do DevOps engineers usually face. Since the purposes of DevOps mostly come down to combining software development and IT operations, we are going to be looking at database issues that usually concern software developers, but some of those issues can also be applicable to other industries aswell. In general, some of the database issues for DevOps engineers come down to automation because as your data grows, the efficient monitoring of your database servers (the amount of which might and probably will increase over time) might become more and more difficult.
dbWatch to the Rescue
As already stated, the efficient monitoring of your database servers is getting more and more complex as your resources expand. You might even have caught yourself wondering what can you do in this space and how can you solve this issue. Worry not, dbWatch has a solution. dbWatch is a highly scalable software solution that helps customers around the globe monitor and manage any number of database servers efficiently while also providing total control over all aspects of operation, performance and resource usage allowing you to maximize the efficiency and minimize the resources you spend on running all of your databases. dbWatch will give you the overview you need to make sure your databases are in shape whatever happens – dbWatch has a pretty extensive customer list including global retailers, hospital groups, IT service providers and even government agencies each with different needs and requirements based on scalability, flexibility, efficiency, security and cost – dbWatch can fulfill all of them.
Here’s how dbWatch looks from the inside. We will let you look at how it looks when launched, then dive into more details later on:
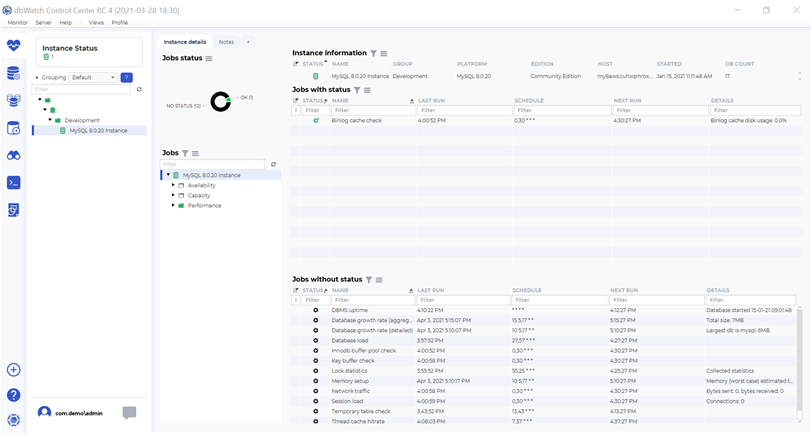
As you can see, dbWatch provides you with the information about the groups of your database instances, the information about the database instance(s) you are monitoring, the jobs that actually monitor your database instances (jobs were previously called tasks – we will get into that later on) and the status of those jobs. We will start from the status of your database jobs:
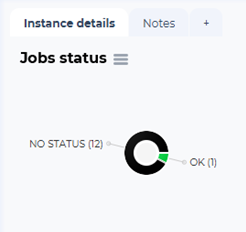
Jobs were previously called tasks – those tasks let you monitor your MSSQL, Oracle, PostgreSQL, Sybase, MySQL or Azure SQL database instance(s) for any anomalies including issues related to database availability, capacity or performance – in fact, availability, capacity and performance are the main categories of dbWatch jobs. The above instance details will tell you how many of your database jobs have which status (statuses can be in three forms: they either can return OK, they also can return an alarm or a warning alerting you of the status of your database instances – an OK sign means that the job did not find any anomalies, a warning sign means that something probably went wrong and you should probably double check the job details and an alarm sign tells you that something is probably very wrong) Here’s what we have in this space:
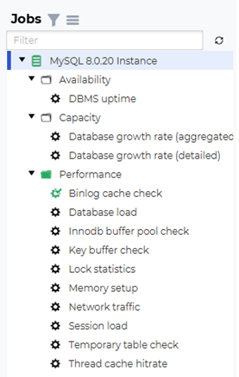
As you can see, as far as MySQL instances are concerned, the availability jobs come down to the DBMS uptime, the database growth rate (which can be either aggregated (that is, shorter) or detailed (longer). The major part of the dbWatch jobs come down to performance optimizations and enhancements: in this space, dbWatch can offer a binlog cache checking job, a database load job, a job that checks the functionality of the InnoDB buffer pool or the MyISAM key buffer, dbWatch can also provide you with some lock statistics, it can analyze the memory setup of your database servers, it can show the network traffic or connection statistics (the session load), dbWatch can also help you find out what percentage of your temporary tables are actually written to disk or show you your thread cache hit rate (that is, how many queries actually access the query cache that way making them faster to run). The dbWatch jobs are automated helping you solve your database issues in DevOps. The dbWatch jobs come with details (that is, you can observe the results) and configuration letting you configure what do you need the jobs to do.
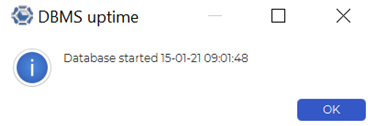
Here’s how some dbWatch job details look like. For example, here’s what happens when you run the DBMS uptime job:
Some simple jobs (like the one above) do not have much configuration parameters, others however, do. Take a look – here’s how the InnoDB buffer pool checking job details look like:
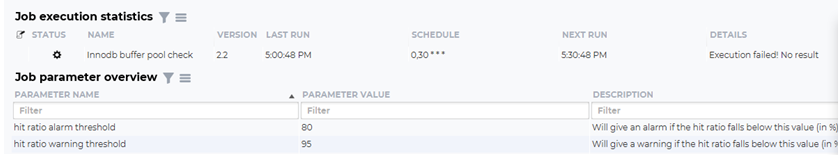
The InnoDB buffer pool checking job allows you to define certain parameter values that will be used to alert you if the InnoDB buffer pool hit ratio falls below certain values meaning that the InnoDB buffer pool will no longer be effective.
The same thing can also be said about other jobs, for example, the MyISAM key buffer checking job (the MyISAM key buffer is an equivalent to the InnoDB buffer pool):
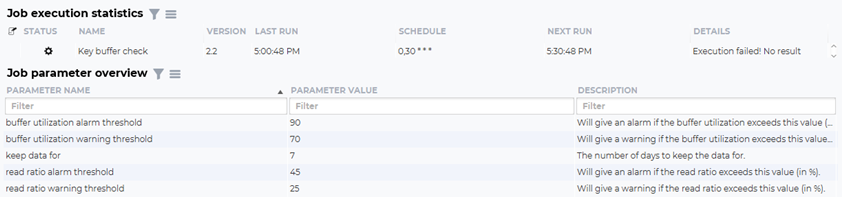
Here’s how its configuration parameters look like:
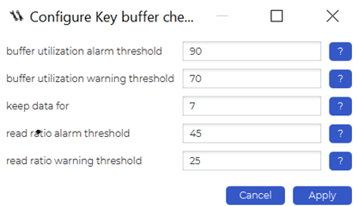
You can see a description of all of those parameters above, but in a nutshell, this particular job will help you optimize your MyISAM engine-based data for optimal performance allowing you to define the buffer utilization alarm or warning thresholds or the read ratio alarm or warning thresholds – this job can give you an alarm or a warning if the read ratio or the buffer utilization exceeds a specified value in percent allowing you to upgrade your database servers or other infrastructure that you might use.
As you can see, the jobs offered by dbWatch can certainly help you solve your database issues that you or the DevOps engineers of your company might face.
Summary
dbWatch makes the solving of the database issues that DevOps brings upon your table very simple. When using dbWatch you can easily monitor any number of database instances meaning that the database issues that you (or anybody on your DevOps engineering team) might face can be solved quickly, easily and effectively. dbWatch is also unique with its combination of closed and open source code meaning that you or any of your developer colleagues can extend the functionalities of the product – all code developed by dbWatch is open to change to suit the needs of any demanding customer request which means that if your DevOps team has any database issues that dbWatch cannot yet solve, chances are that you can create an extension of the product to fit your needs – to do that, have a look through the documentation and always contact the team if you need any further assistance.
Other Blogs:
Is the monitoring of your Database Instances Locked in to a Vendor?
Challenges of scaling MySQL: dbWatch to the rescue


