
If you are a database administrator, especially if you find yourself being a Microsoft SQL Server DBA, you probably find yourself needing to take care of a lot of things: these things might include the availability, security, capacity, or performance of your database instances, but there might be a couple of smaller things you would need to take care of: one of these things would include keeping an eye out on the memory of your SQL Server instances.
----------------------------------------------------------------------------------------------------------

What Would You Need to Monitor in Your SQL Server?
If you are a SQL Server administrator, you probably know a thing or two about MS SQL. You probably know that the things you need to monitor in this database management system include, but are not limited to:
- Availability – you will save yourself a lot of headaches related to constant monitoring of your instances if you let tools like dbWatch ensure that all of your database instances would stay highly available.
- Performance – performance is one of the most important parts of any database instance. Let tools like dbWatch figure out how best to assist you in your database performance journey and your databases should reach new heights sooner than you think.
- Security – properly securing anything from hackers, especially in those COVID-ridden days, is crucial. The security of your SQL Server database instances would also heavily depend on the tools that you pick to monitor it, so always keep an eye out for the security offerings of a certain tool as well.
- Capacity – if you’re a database administrator, you probably keep an eye out for the disks existing in your environment as well, don’t you? Leave that to tools like dbWatch – they can alert you once your disks start getting filled up with data so that you know when it’s time to replace them.
As you can see, SQL Server DBAs monitor a lot of things – however, while disk space and other things are incredibly important, what is just as important is the ability to monitor the memory usage of your SQL Server as well.
How is Your Memory Doing?
Tools like dbWatch can let you monitor all of the aforementioned things. Just launch dbWatch and you will be able to observe that that is, indeed, true:
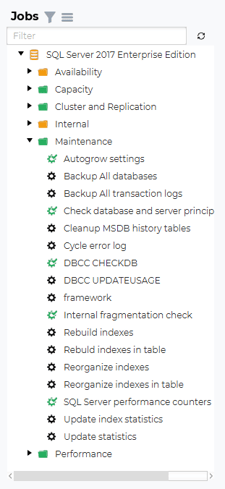
As you can see, dbWatch lets you monitor the availability, capacity, set up clustering and replication, it will also let you maintain your SQL Server instances. However, what we are interested in the most for this blog post, is the dbWatch’s ability to monitor the memory of your SQL Server, so let’s take a look at that as well. Expand the Performance section:
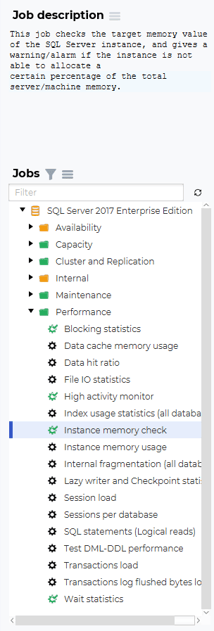
You will see two database jobs that are related to the memory of your SQL Server instances. One job – the instance memory check – will provide you with a warning or with an alarm if your database instance wouldn’t be able to allocate a certain amount of memory to your database instance while another job would be useful if you find that you need to check how much memory is actually used by your SQL Server database instances themselves.
Both jobs can be configured – for example, right-click on the Instance memory checking job and you will see this:
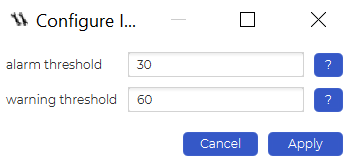
The job will allow you to set an alarm threshold and a warning threshold – these two (alarm and warning) thresholds will be triggered when SQL Server is not able to allocate a given percentage of memory. In other words, if SQL Server is not able to allocate more than 30% of memory existing on the server to itself, dbWatch will raise an alarm, while if SQL Server would not be able to allocate more than 60% of memory, dbWatch would provide a warning.
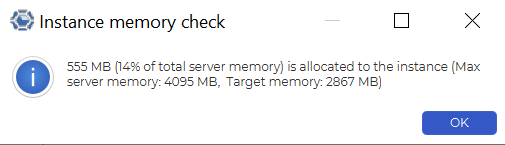
With that being said, you can always keep an eye out on the results to see how much memory is allocated to your database instance currently:
You might also sometimes want to check how much memory of the instance is allocated where – for that, dbWatch has the “Instance memory usage” job. For example, here’s how it’s results look like:
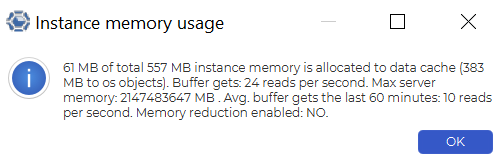
While everything might look a little complex at present, don’t fret – everything is easier than it might seem. This dbWatch job provides you with the information that lets you see where a certain amount of your database memory goes – in this case, we see that some of our memory is allocated to the data cache and the memory reduction is disabled. We also see that the buffer, on average, gets 10 reads per hour, so it’s really not too bad. Everything looks okay! However, if you would also want to change the functionality up a little, you would need to configure the job:
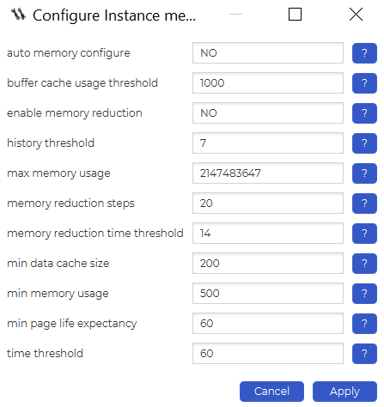
In this case, dbWatch would let you set whether you want to enable or disable the memory reduction, how much memory your SQL Server is allowed to consume, or the minimum amount of memory it can be reduced to (setting these kinds of parameters up might be helpful if you find yourself being under certain project-related constraints or something else), you can also set the average value of reads per second that you want your SQL Server instances to reach before dbWatch intervenes with your SQL Server (starts to reduce the memory usage.)
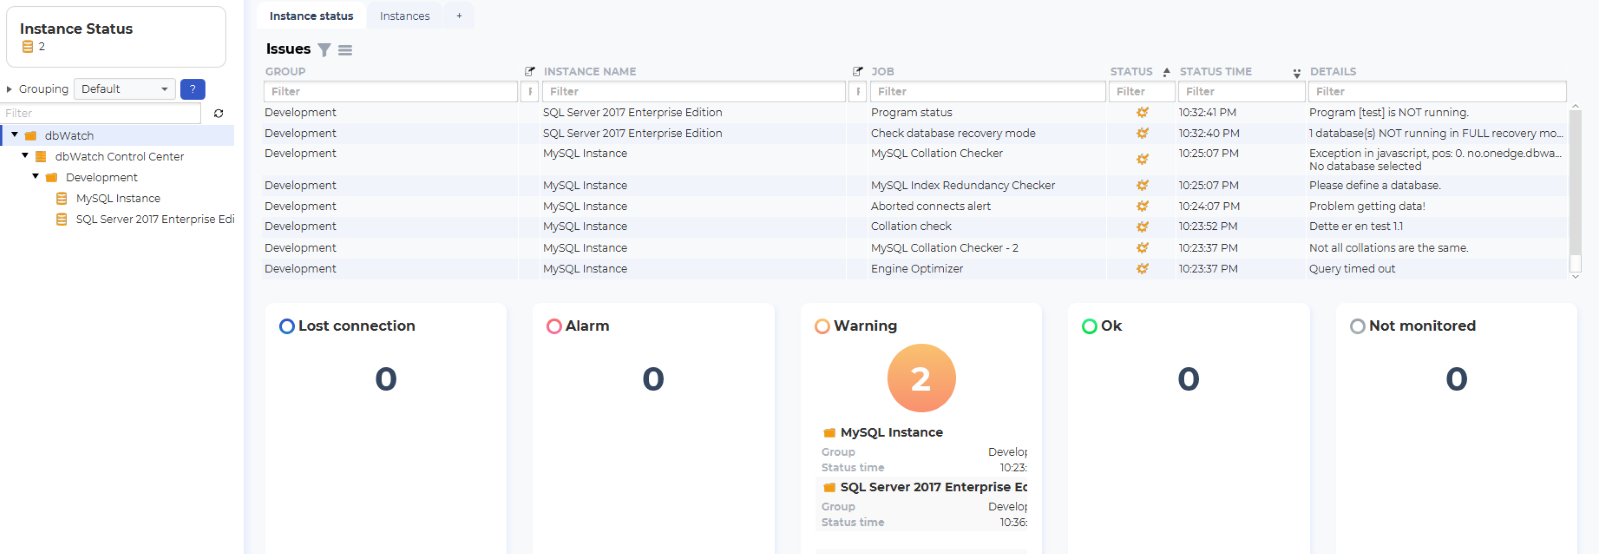
However, that’s not it – dbWatch can also be used for a couple of other things related to monitoring, such as listing how your database instances are doing overall – on the Instance status page you could also see all of the issues related to your SQL Server. To solve them, keep an eye out on the details and act accordingly:
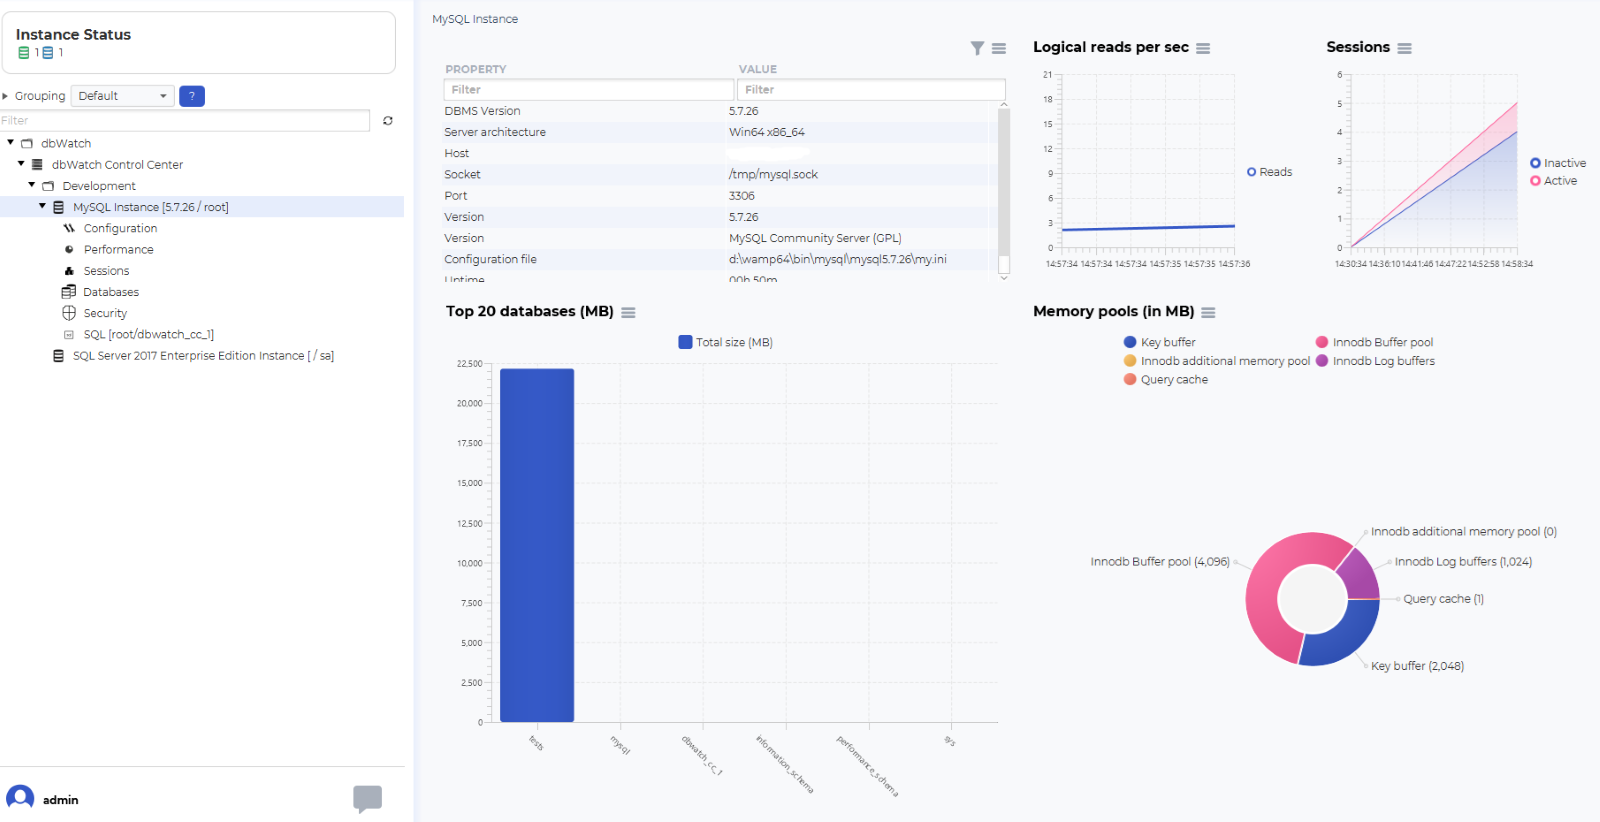
dbWatch will also let you observe multiple other things related to other types of database instances (for example MySQL.) You can observe the amount of logical reads per second, also the amount of active or inactive sessions, and all of the properties related to your database instances.
Keeping an eye out on your properties is a very important thing too – in this space, dbWatch is able to provide information relevant to your server architecture and version of your database instance, and save you some hassle related to locating the configuration file of your database instances too.
The graphs provided by dbWatch will also let you configure your database instances for maximum performance and act accordingly as well – we hope that these features of dbWatch are enough to make you consider using the tool for your projects or business, but if it’s not, keep an eye out on the documentation, reach out to support to solve your issues, and you should see the performance of your SQL Server (or SQL Server Express) and other database management systems skyrocket soon enough. See you in the next blog!
-------------------
Other blogs:
Databases for Senior Developers - Monitoring Databases with Tools
-------------------
About the Author:
Lukas Vileikis is an ethical hacker and a frequent conference speaker.
Since 2014, Lukas has found and responsibly disclosed security flaws in some of the most visited websites in Lithuania.
He runs one of the biggest & fastest data breach search engines in the world - BreachDirectory.com, frequently speaks at conferences and blogs in multiple places including his blog over at lukasvileikis.com.


