
About the Author:
Lukas Vileikis is an ethical hacker and a frequent conference speaker.
Since 2014, Lukas has found and responsibly disclosed security flaws in some of the most visited websites in Lithuania.
He runs one of the biggest & fastest data breach search engines in the world - BreachDirectory.com, frequently speaks at conferences and blogs in multiple places including his blog over at lukasvileikis.com.
----------------------------------------------------------------------------------------------------------
If you’re a DBA of any sort, you are probably dealing with one or more database servers (for example, MSSQL, Oracle, PostgreSQL, Sybase, MySQL, Azure SQL, or other instances. If you are dealing with one or more database instances, chances are you are using dbWatch to monitor your database servers – this blog post will go over the end-user product architecture of dbWatch. We will mention why it is so essential to understand and what it contains. But first, we should tell you why you should use dbWatch in the first place.

Why Should I Monitor My Database Instances in dbWatch?
dbWatch’s vision is to develop and deliver the best possible solutions for complete and total database management and monitoring. For you, monitoring your database (for example, MySQL) instances might mean checking the InnoDB buffer pool size or MyISAM’s key buffer size, it might mean that you need to monitor how much free tablespace you have, etc. – it might even suggest using a custom language (for example, FDL) to monitor the performance of your MS SQL Server, Oracle, Sybase, PostgreSQL, MariaDB or MySQL instances. The dbWatch team is comprised of leading database experts in Norway – the software can help you solve your database management and monitoring issues in no-time.
How does dbWatch Look From the Inside?
The end-user product architecture of dbWatch does depend on the operating system it’s used on. For example, if you’re using the current version of the ControlCenter on Windows, the files will most likely be scattered across your computer in a certain way. You will find files related to the dbWatch Control Center in the following directories:
- C:/Program Files/ControlCenter
- C:/ProgramData/dbWatchControlCenter
- C:/Users/youruser/.dbwatch/.monitor
- In the Program Files directory, you will most likely find the following files (we have
- highlighted a couple of the most important ones):
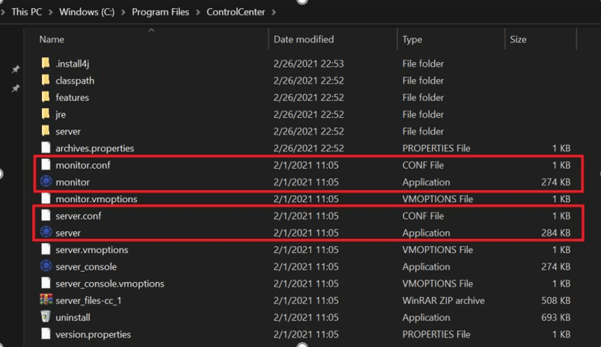
- - The monitor.conf file depicts the startup configuration of the dbWatch monitor.
- - The server.conf file depicts the startup configuration for the dbWatch server.
- - The applications allow you to launch the dbWatch monitor and the dbWatch server, respectively.
In the ProgramData folder, you will most likely find the following architecture:
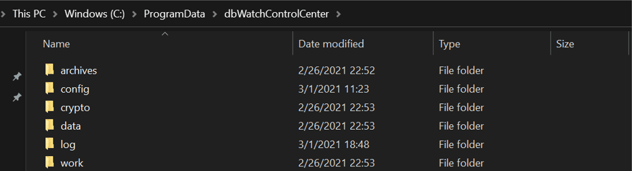
As far as the ProgramData folder is concerned, here’s what you have to remember:
- - The archives folder stores all of the miscellaneous data related to dbWatch (connectors, dependences, repository files )
- - The config folder stores all of the configuration files related to the dbWatch Control Center (the server configuration, the authentication and authorization files, the license files )
- - The crypto folder stores all the information related to dbWatch’s encryption (i.e the keys )
- - The data folder stores all of the data that can be used by the dbWatch Control Center. - The folder contains multiple subfolders:
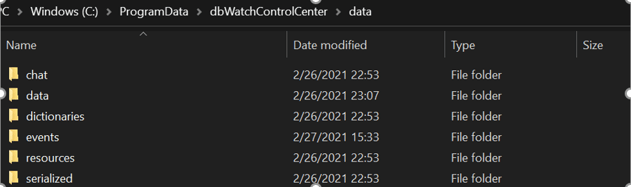
The chat folder contains all of the information related to the chat (the chat can be found at the bottom left corner of the dbWatch Control Center), the events folder stores all of the events needed for dbWatch to function correctly and the resources folder stores all of the available resources (the admin specifications provided by the user, the reports provided by dbWatch etc.):
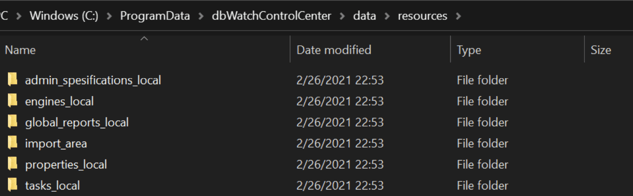
The resources folder can be useful if, for example, you have a custom job for dbWatch and want to test its functionality. Simply drag and drop the .xml file to the import_area folder, run it in dbWatch and you’re done!
The dbWatch Control Center also stores files in the Users folder. The files related to the dbWatch Control Center are stored in the .dbwatch folder – the files are stored there after you fill in the information (i.e you specify an admin user) in the dbWatch Domain Login screen:
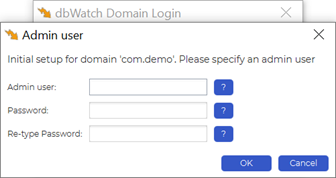
Here’s how the architecture of files look like there:
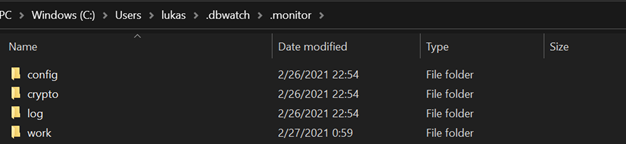
As a user, what you might find particularly interesting here is the log directory and its contents:
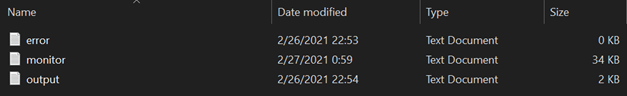
If you encounter any unusual issues or errors while using ControlCenter, the error file is definitely worth looking into. Also consider looking through other files in the directory too – for example, the monitor text file depicts all of the information when the dbWatch Control Center was started, the memory information, information about the VM properties etc.
Summary
The end-user product architecture of dbWatch isn’t as complex as it might seem at first glance – we hope that this blog post showed you how dbWatch operates under the hood. To make sure you’re getting the best out of what dbWatch can offer, consider having a read through the documentation of the dbWatch ControlCenter and always contact the team if you need any assistance – they will be happy to help.
Other Blogs:
Create a customized database performance view in dbWatch
dbWatch Control Center for managing Database Farms


